 Catalalogue de l'ORE OMERE
dataset
Type of resources
Available actions
Topics
Keywords
Contact for the resource
Provided by
Formats
Representation types
Update frequencies
status
Scale
-
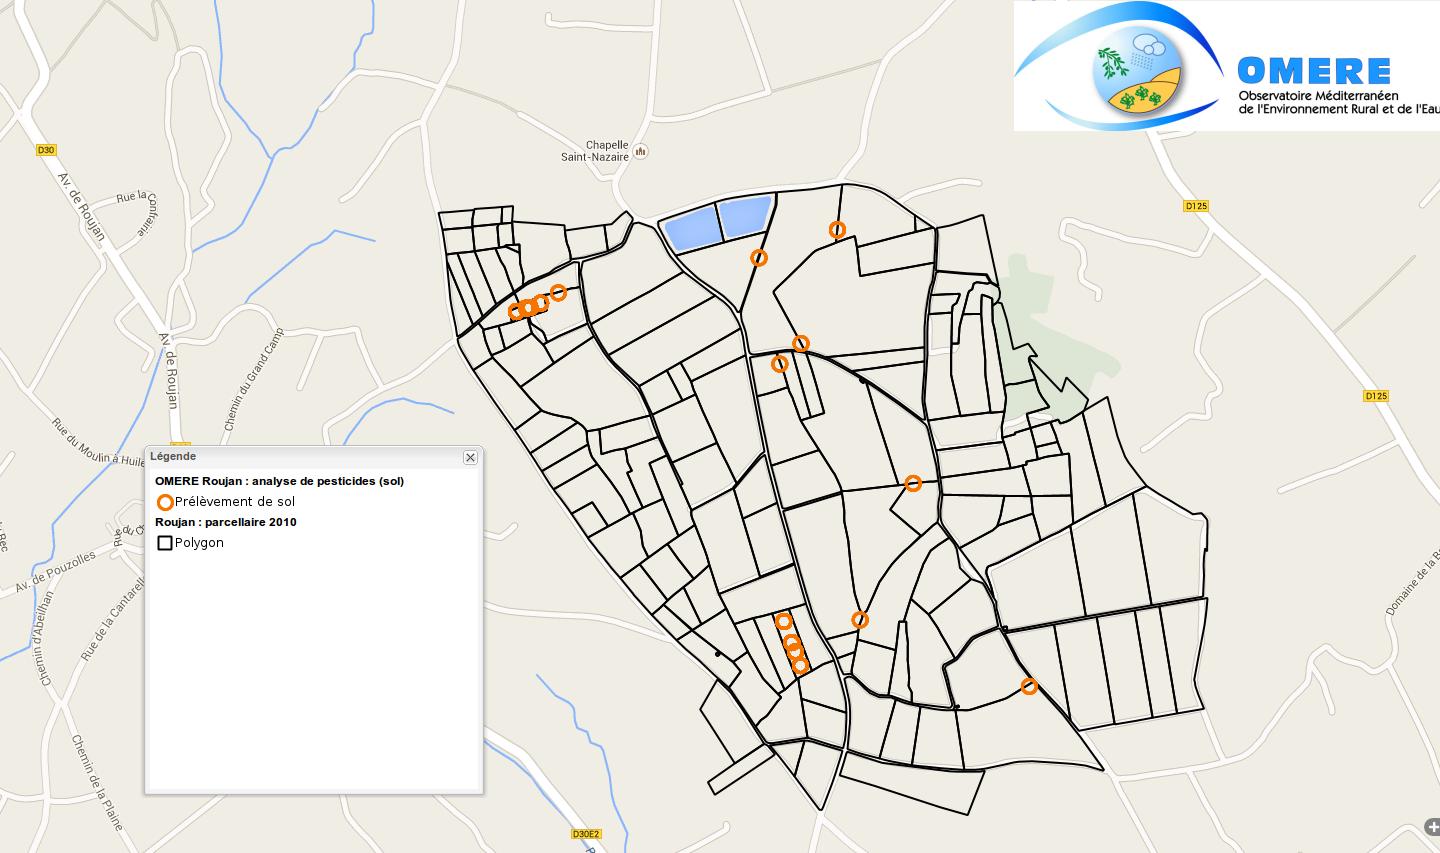
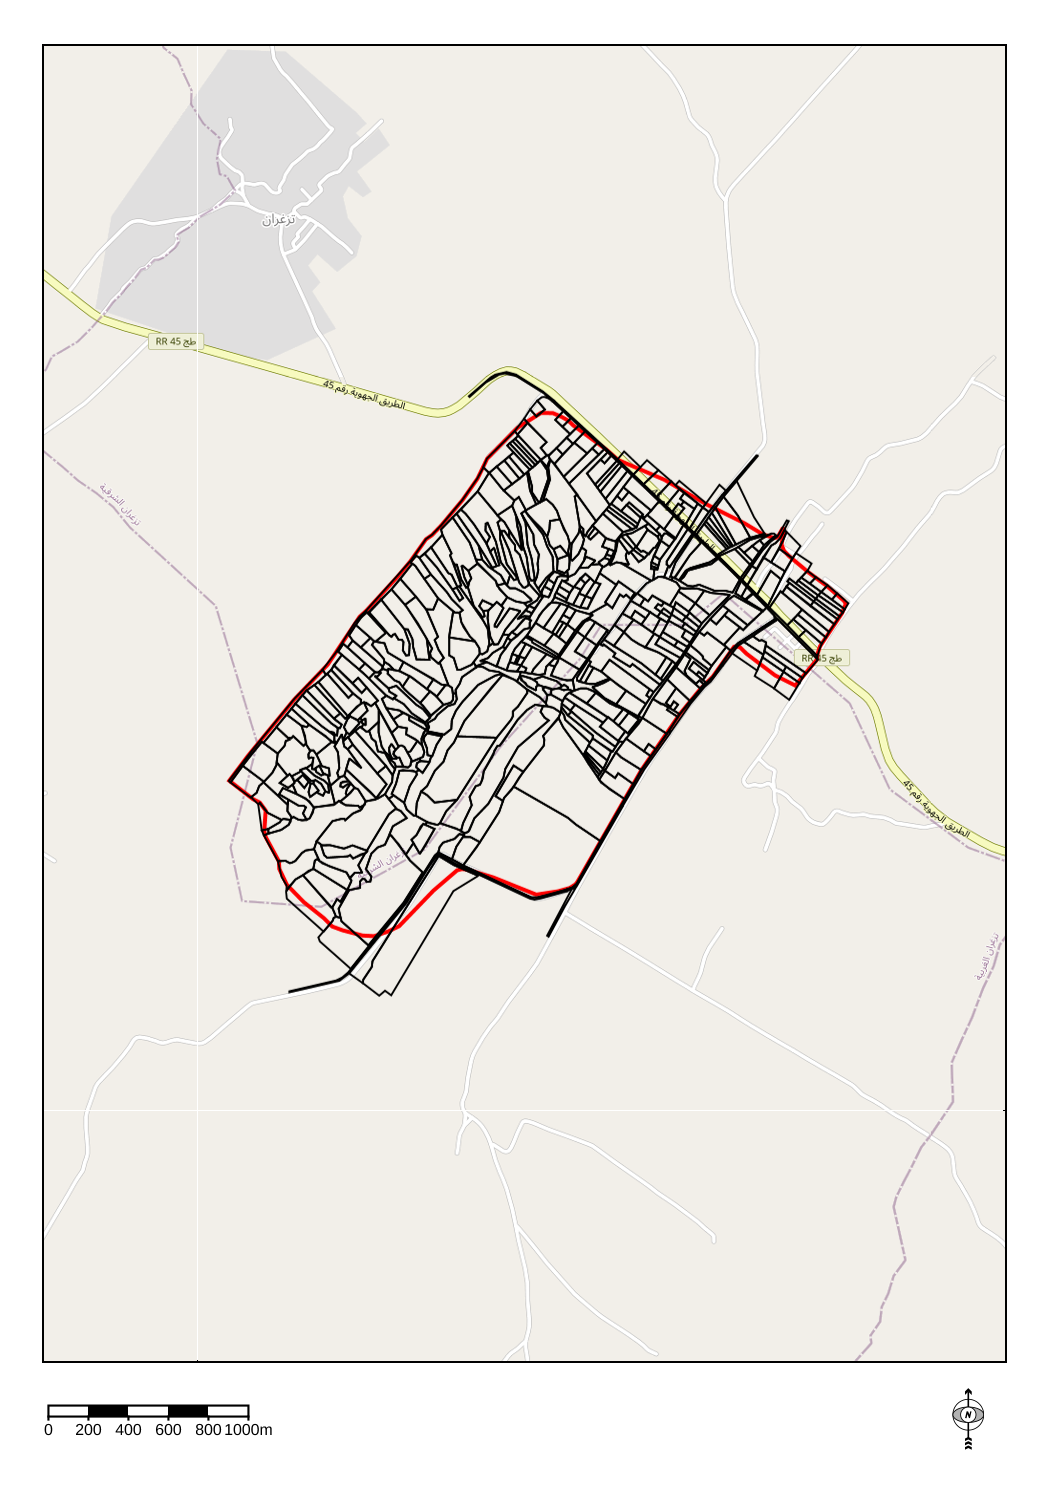
Evaluation of pesticides contents in cultivated soils in the Roujan catchment area.
-
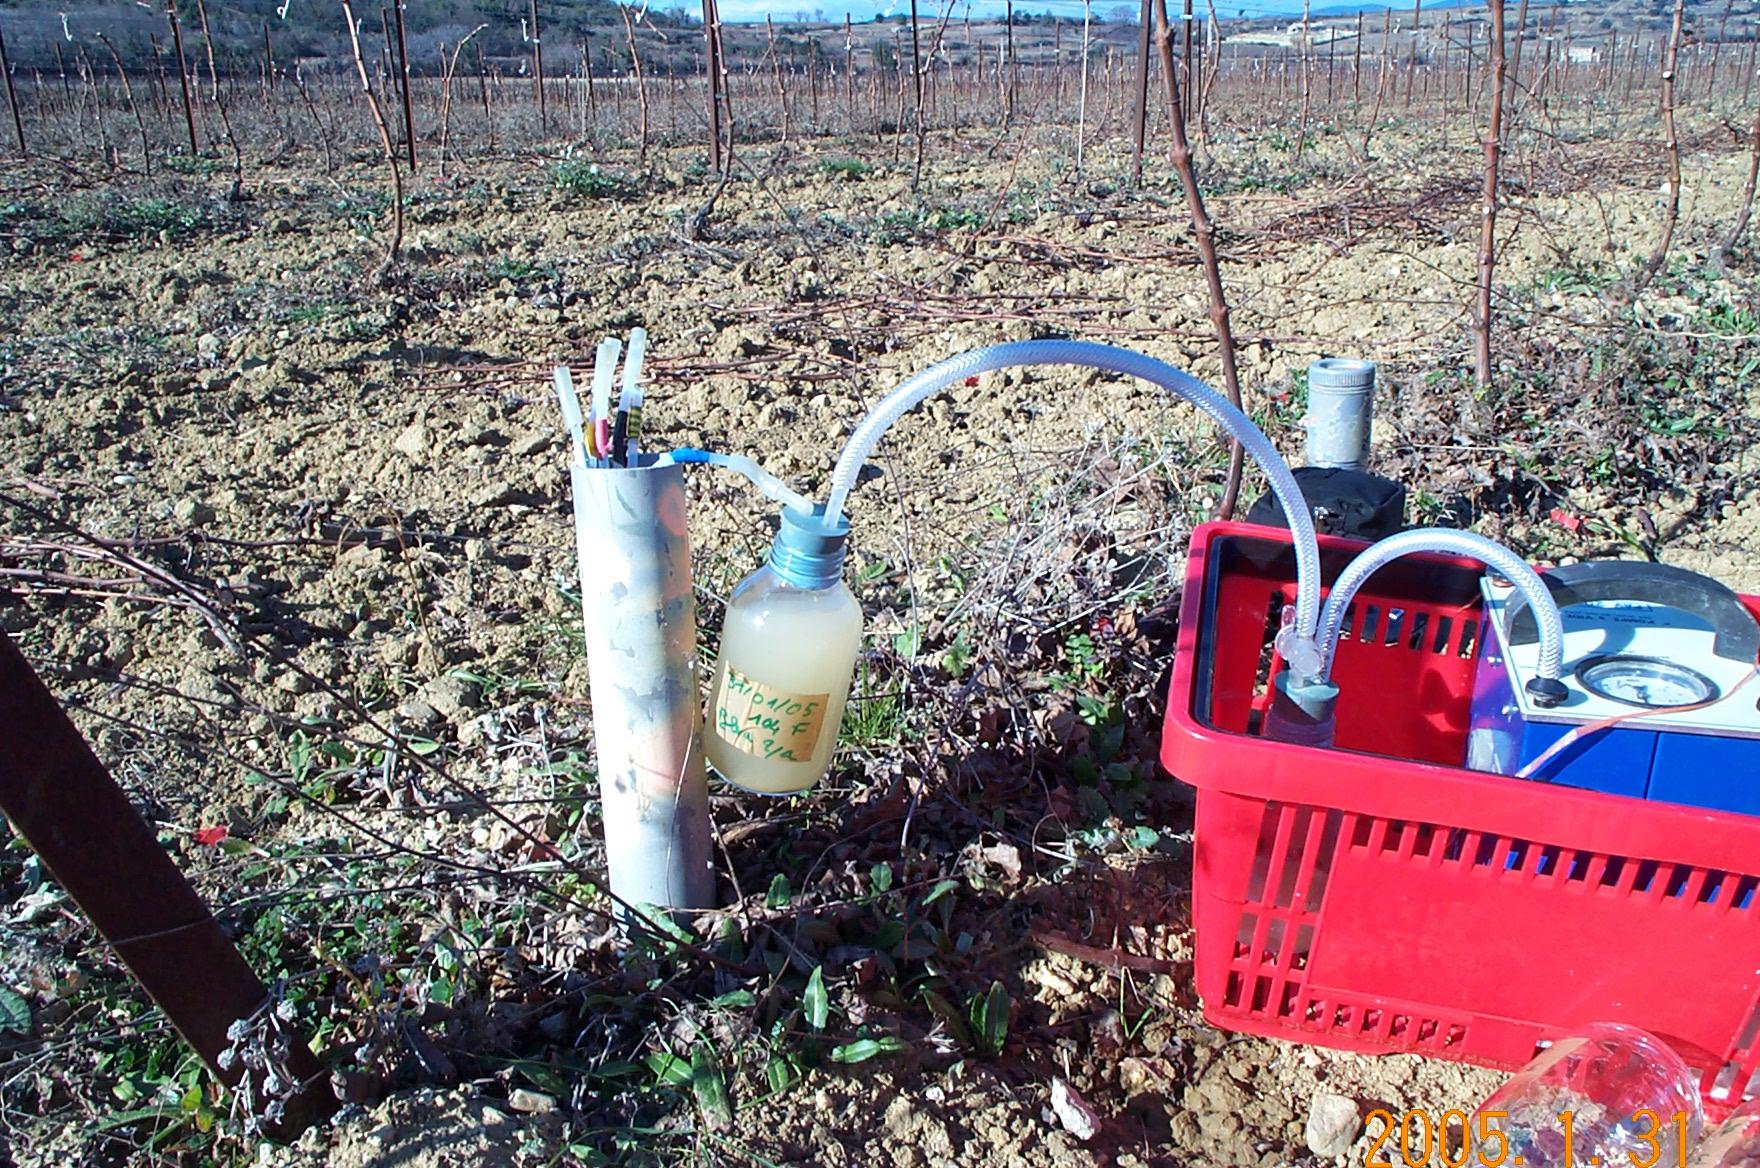
Pesticide contents are determined on the suspended matter extracted by filtration (0,7µm) in runoff water. Contents allow quantification of particula transport of pesticides and allow too compare it to solute transport.
-
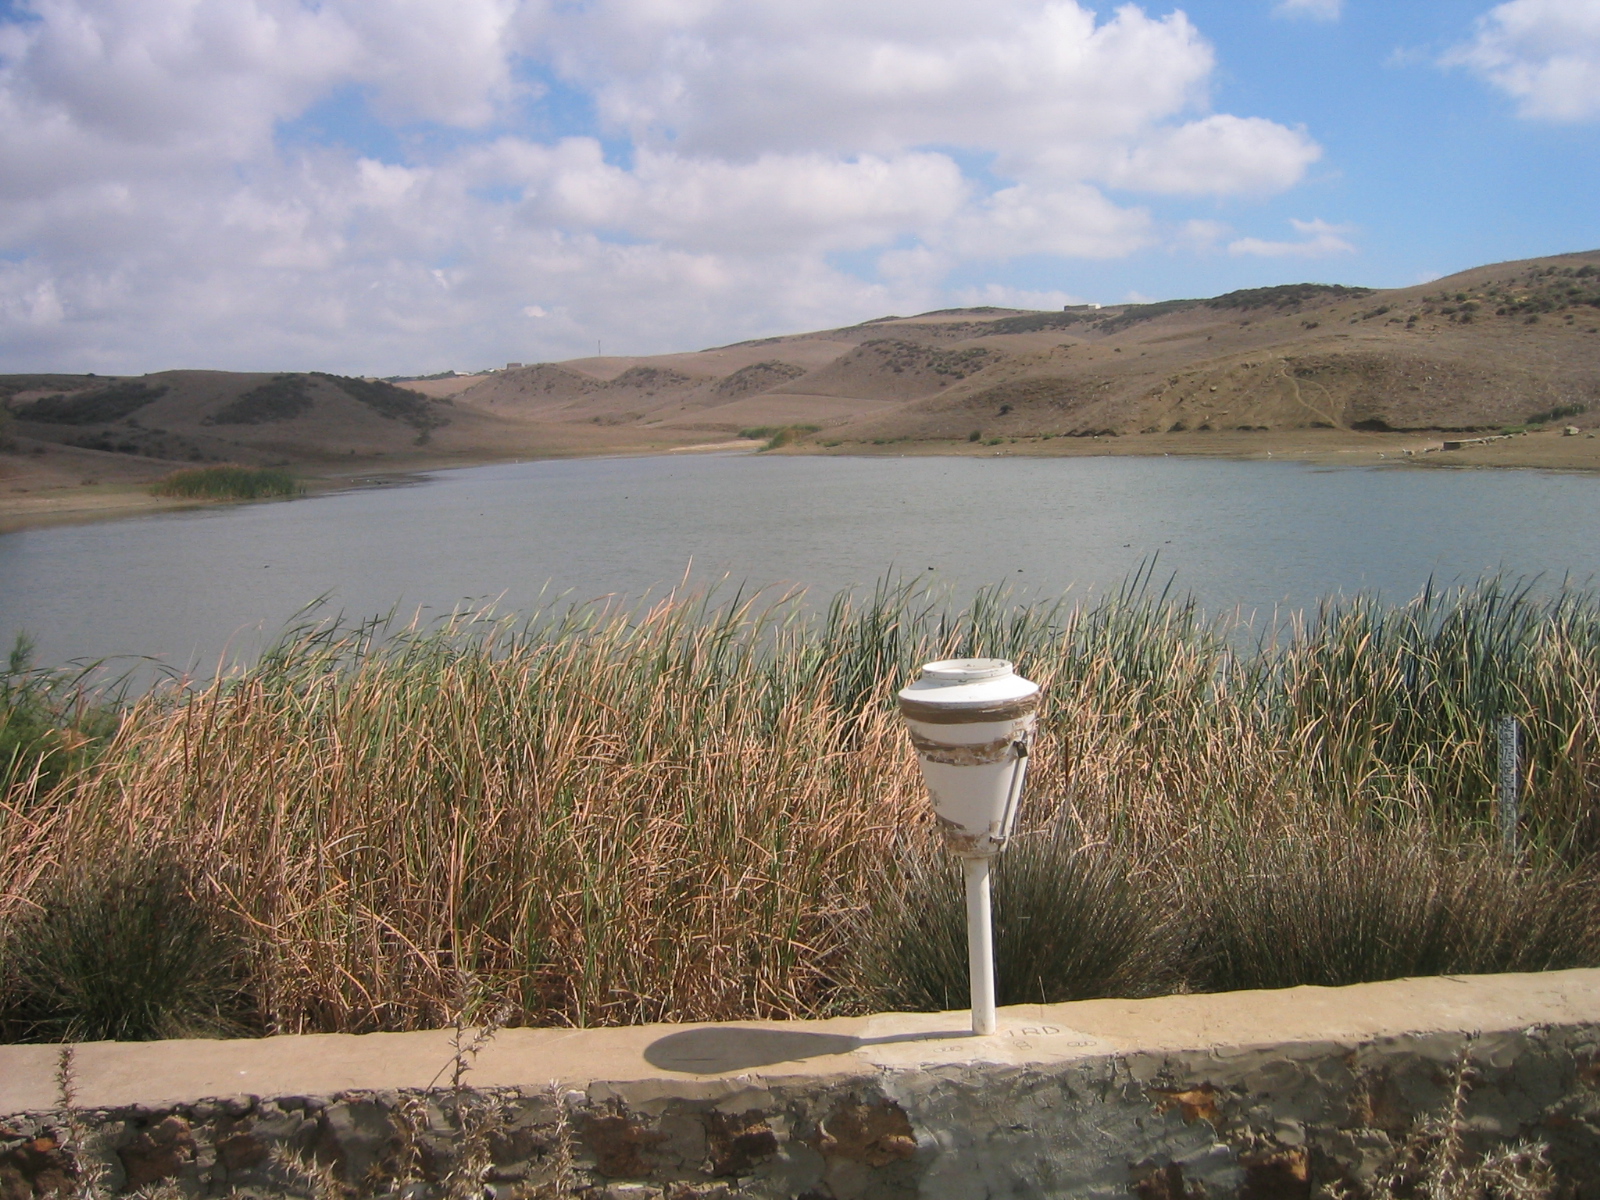
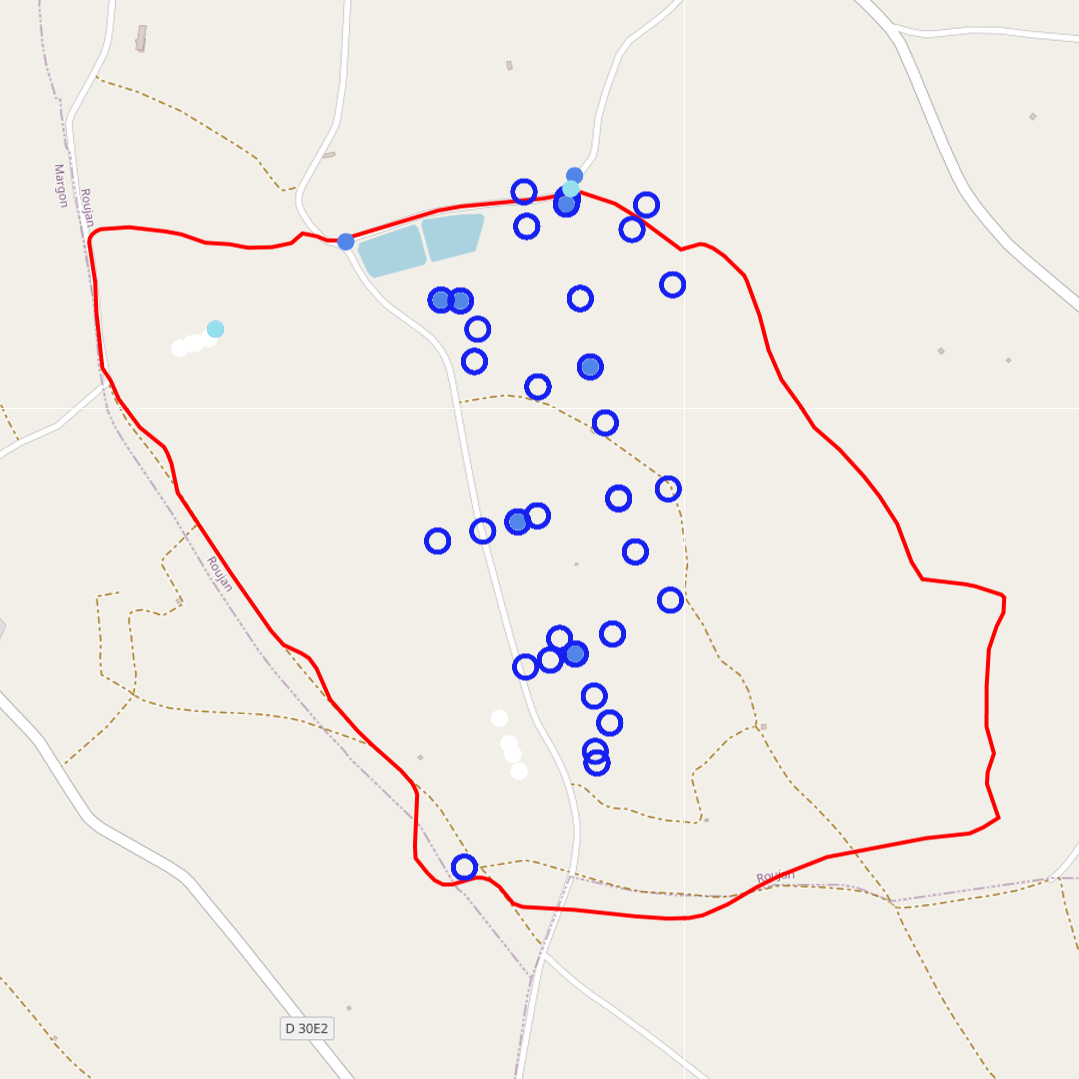
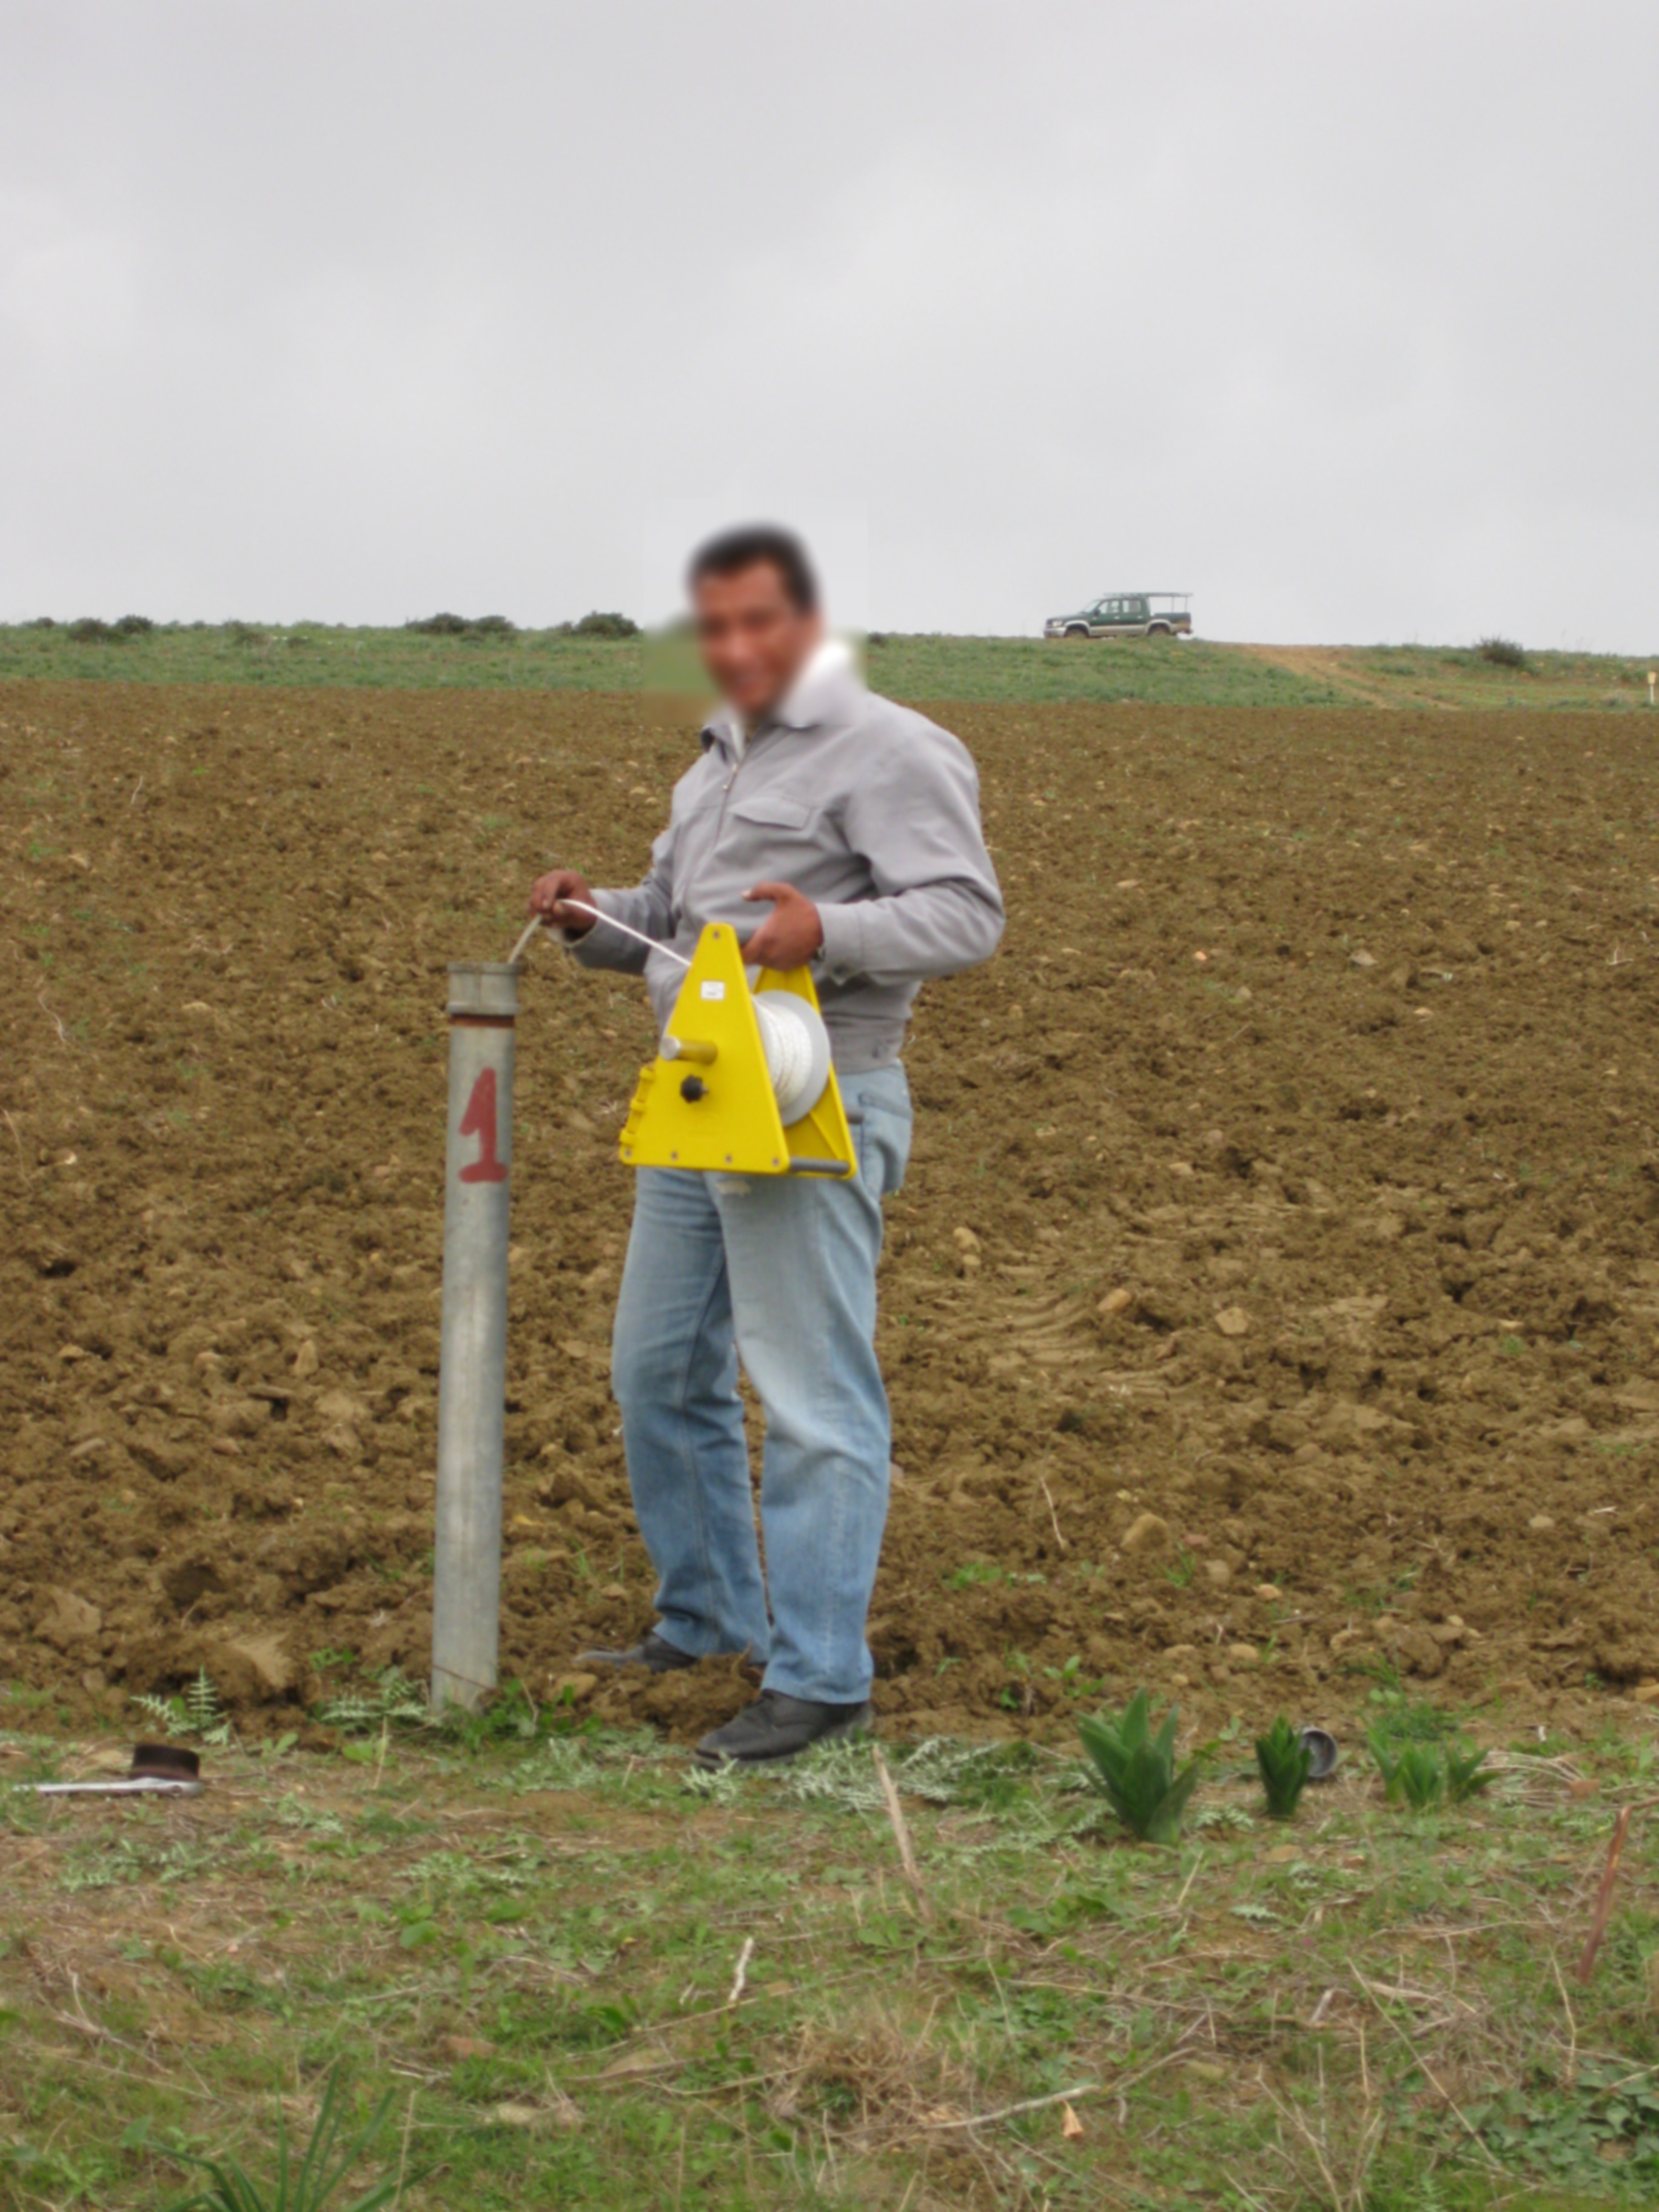
The water table depth from the soil surface is measured at different points in the Roujan catchment. In Roujan site, the groundwater is shallow with a free surface water table rising and falling in the soil and subsoil layers. The measurements are made at different points in the catchment with piezometers. A piezometer is a perforated PVC tube at its base installed in the soil through a borehole. In every piezometer, the water table depth is measured by manual piezometric probe or monitored at high frequency (~15') with autonomous and automatic probe integrating acquisition units. Through the OMERE data portal accessible from this website, the data can be downloaded from an interactive map.
-
The monitoring of suspended sediment loads in runoff and stream flows aims to quantify the amount of sediments translocated during runoff events. These measurements contribute to the understanding and the quantification of the soil redistribution induced by water erosion processes. The measurements of suspended matter are made through manual and automated water sampling at the hydrological stations, which are then processed and analysed in the laboratory to derive suspended sediment concentrations. A turbidimeter has been recently installed to complete the time series of sediment discharge. Suspended sediment concentrations are integrated into the HYSAE database, they can subsequently be consulted and downloaded via the OMERE data portal.
-
-
-
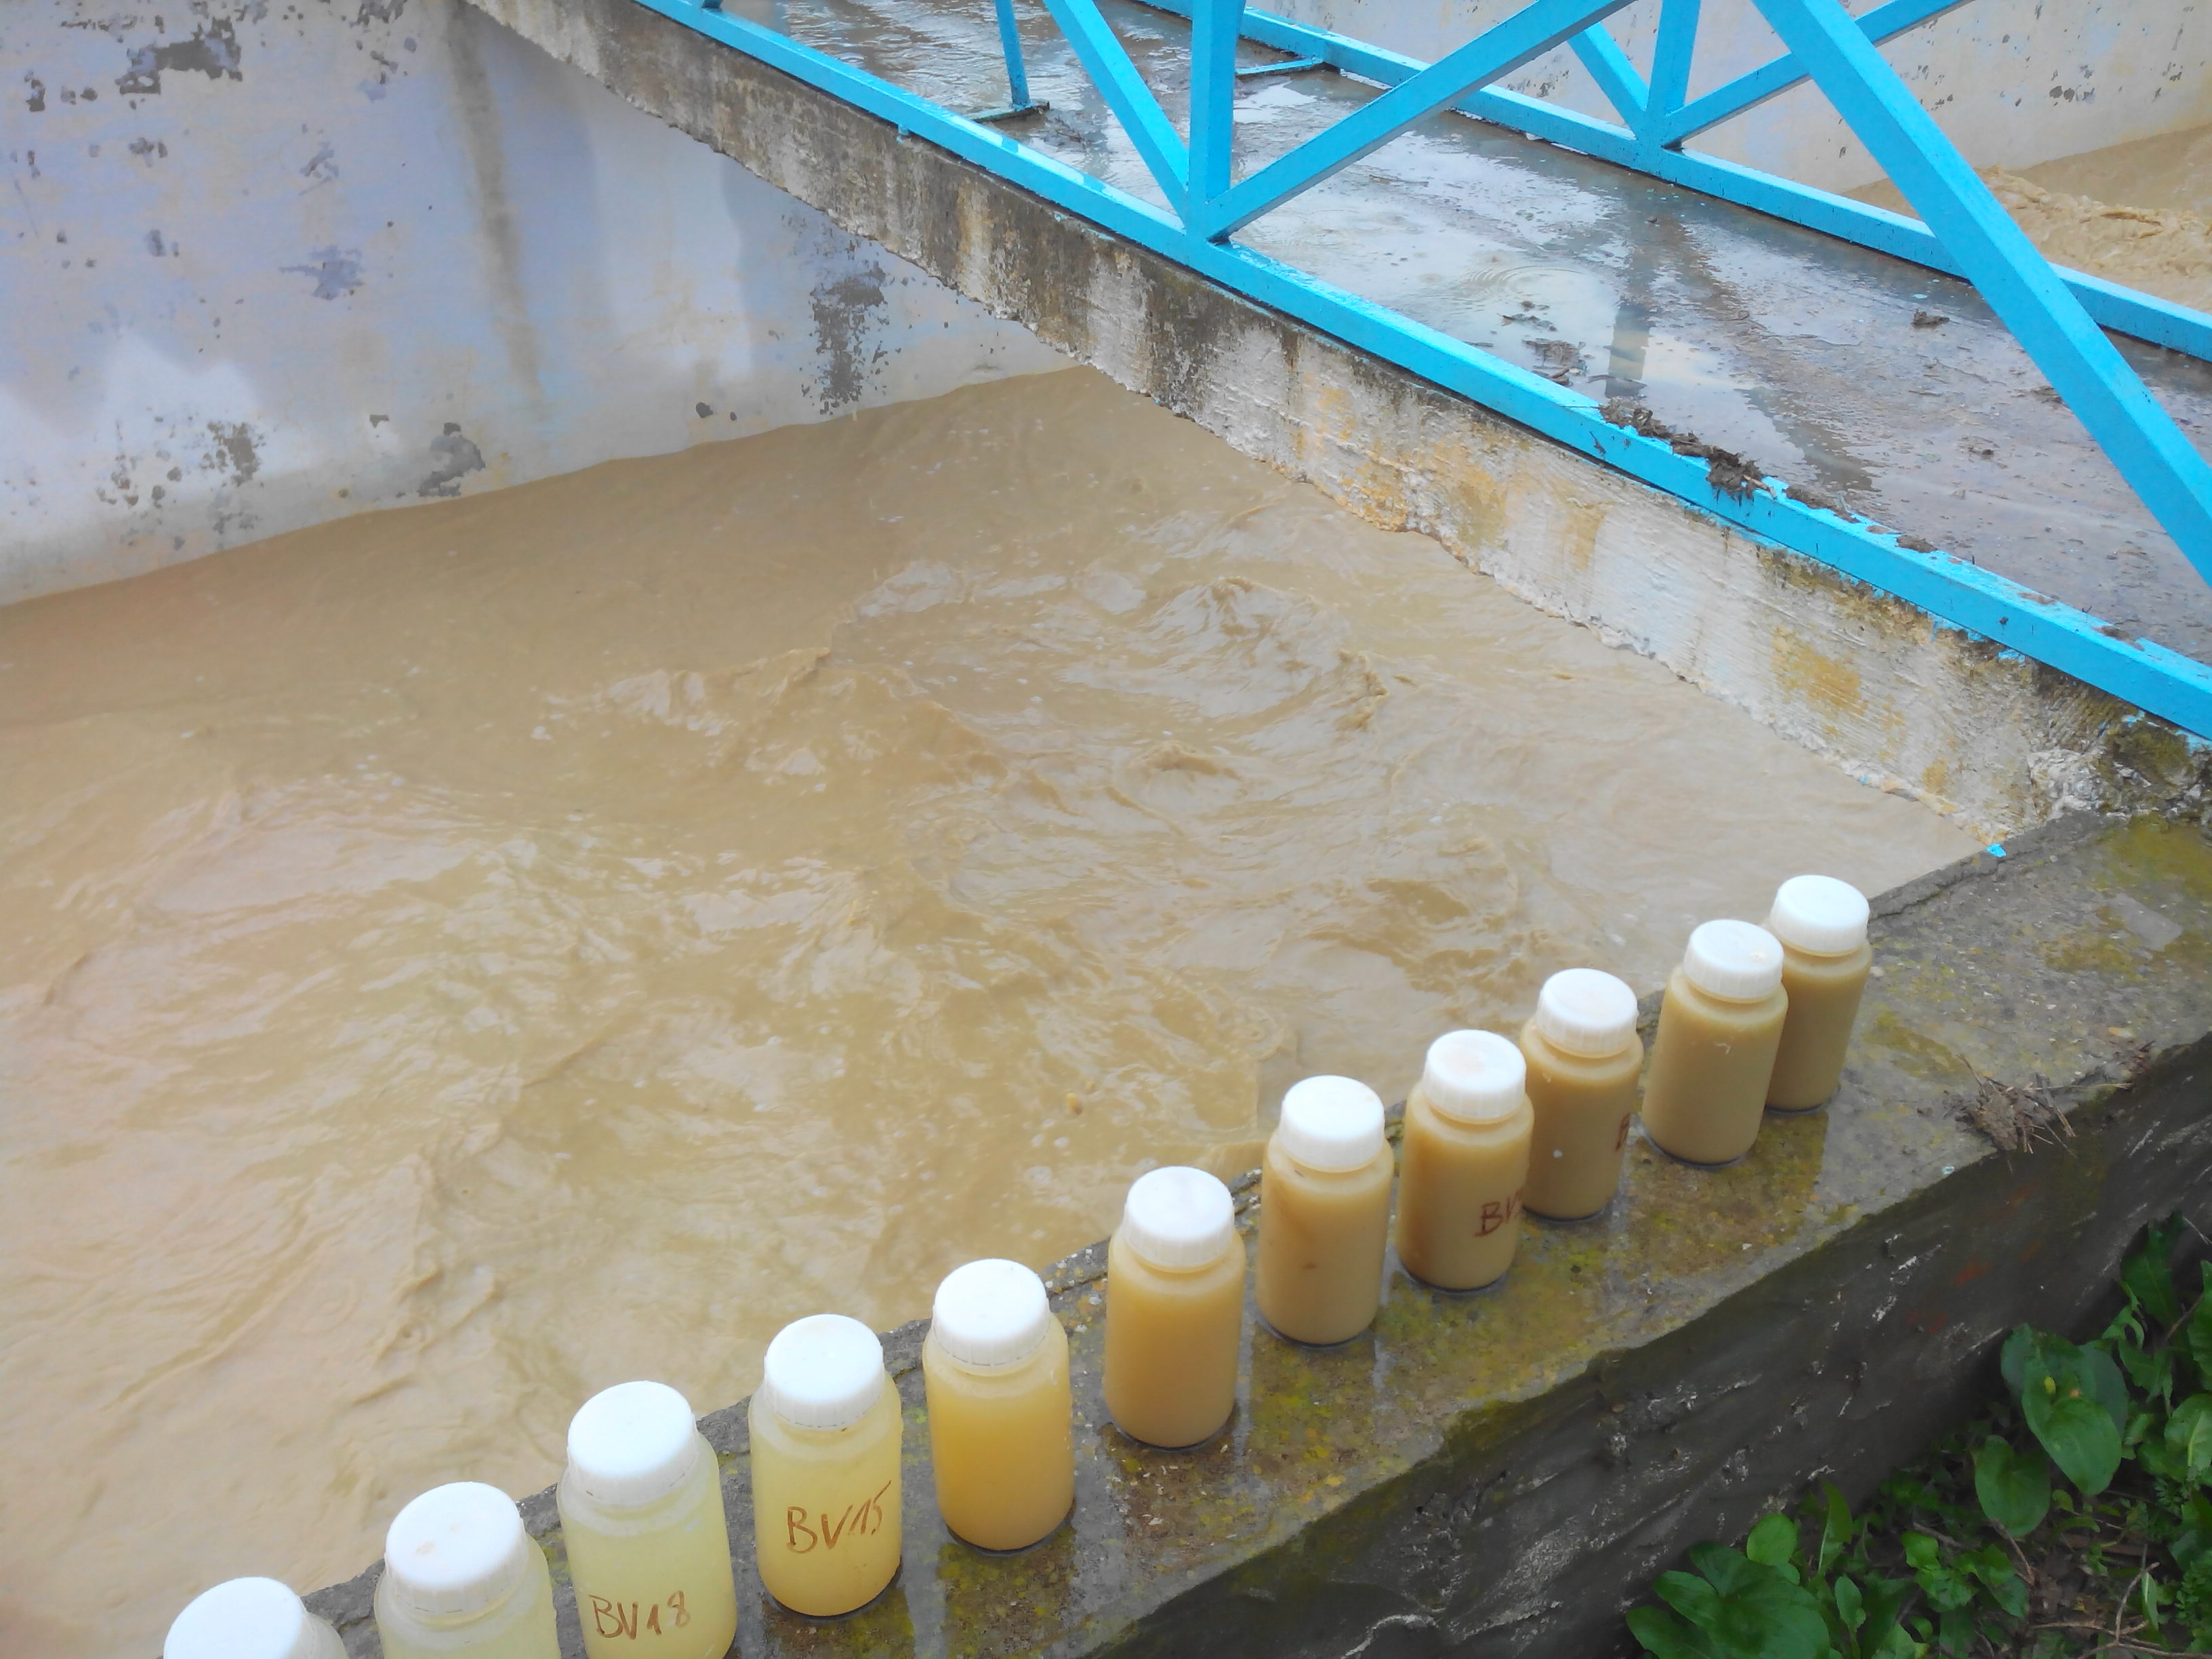
The monitoring of suspended sediment loads in runoff and stream flows aims to quantify the amount of sediments translocated during runoff events. These measurements contribute to the understanding and the quantification of the soil redistribution induced by water erosion processes. The measurements of suspended matter are made through manual and automated water sampling at the hydrological stations, which are then processed and analysed in the laboratory to derive suspended sediment concentrations. A turbidimeter has been recently installed to complete the time series of sediment discharge. Suspended sediment concentrations are integrated into the HYSAE database, they can subsequently be consulted and downloaded via the OMERE data portal.
-
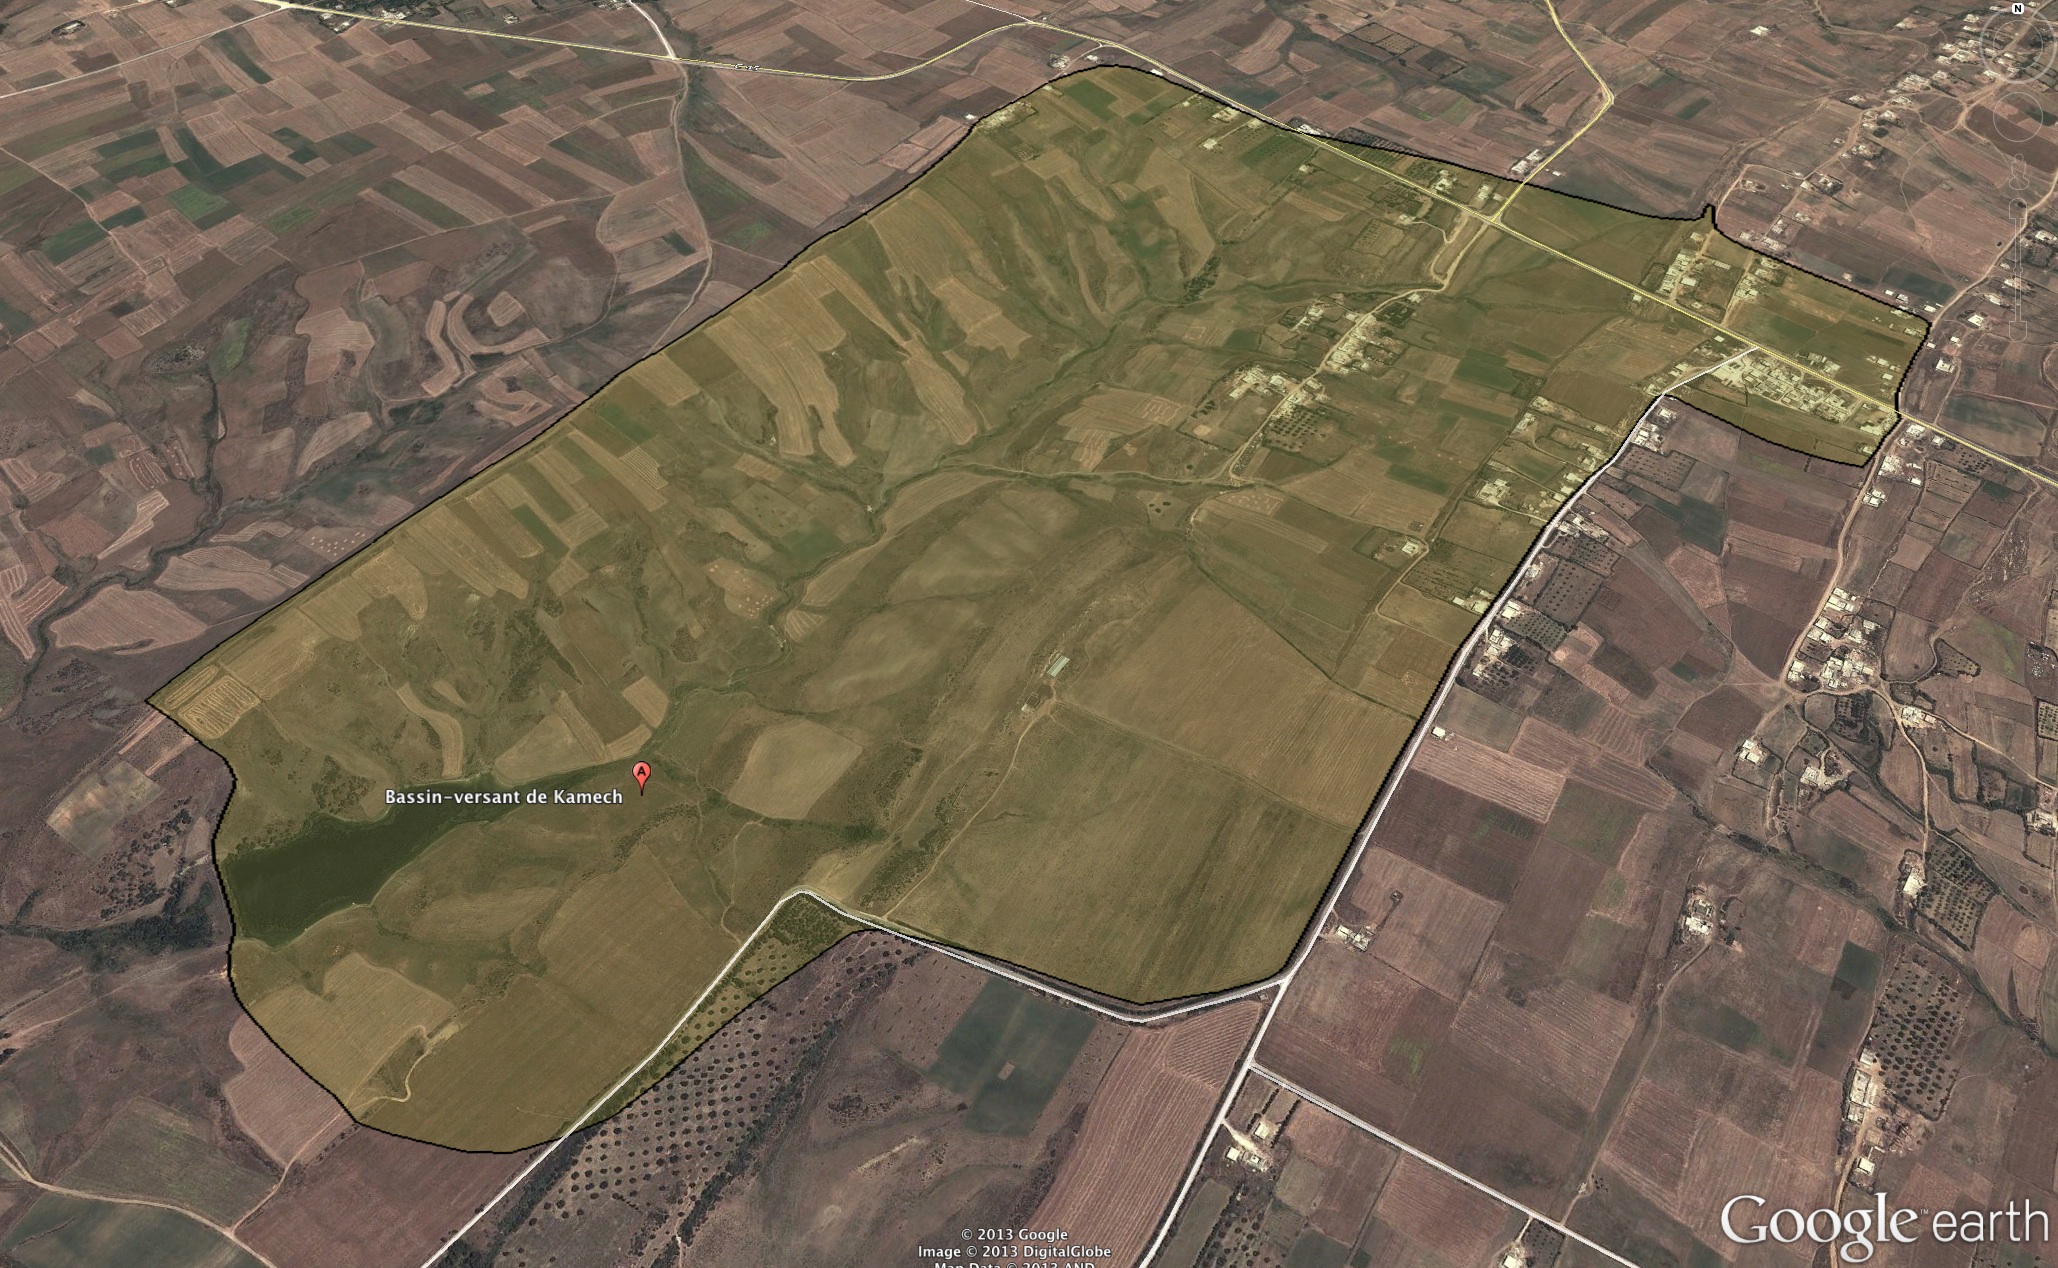
The measurement of rainfall in Kamech catchment (Cap Bon/Tunisia) is operational since 1994 through a network of daily and instantaneous (tipping bucket) rain gauges, some of them being remotely connected to servers in Montpellier. Verification treatments and possible corrections aare applied before the data sets are integrated into the HYSAE database. A "synthetic" rainfall dataset derived from these measurements and accessible from the OMERE data portal is elaborated as a complete and uninterrupted chronicle of rainfall data for the catchment area.
-
The physico-chemical parameters measured in the Roujan basin and accessible via the data portal concern the measurement of elements such as pH, redox potential, temperature and conductivity, carried out during sampling in the basin.
-
The groundwater temperature is measured at different points in the Kamech catchment. In Kamech site, the groundwater is shallow with a free surface water table rising and falling in the soil and subsoil layers. The measurements are made at different points in the catchment with piezometers. A piezometer is a perforated PVC tube at its base installed in the soil through a borehole. In every piezometer, the groundwater temperature is monitored at high frequency (~15') with autonomous and automatic temperature probe integrating acquisition units. Through the OMERE data portal accessible from this website, the data can be downloaded from an interactive map.