 Catalalogue de l'ORE OMERE
Hydrology
Type of resources
Available actions
Topics
Keywords
Contact for the resource
Provided by
Formats
Representation types
Update frequencies
status
Scale
-
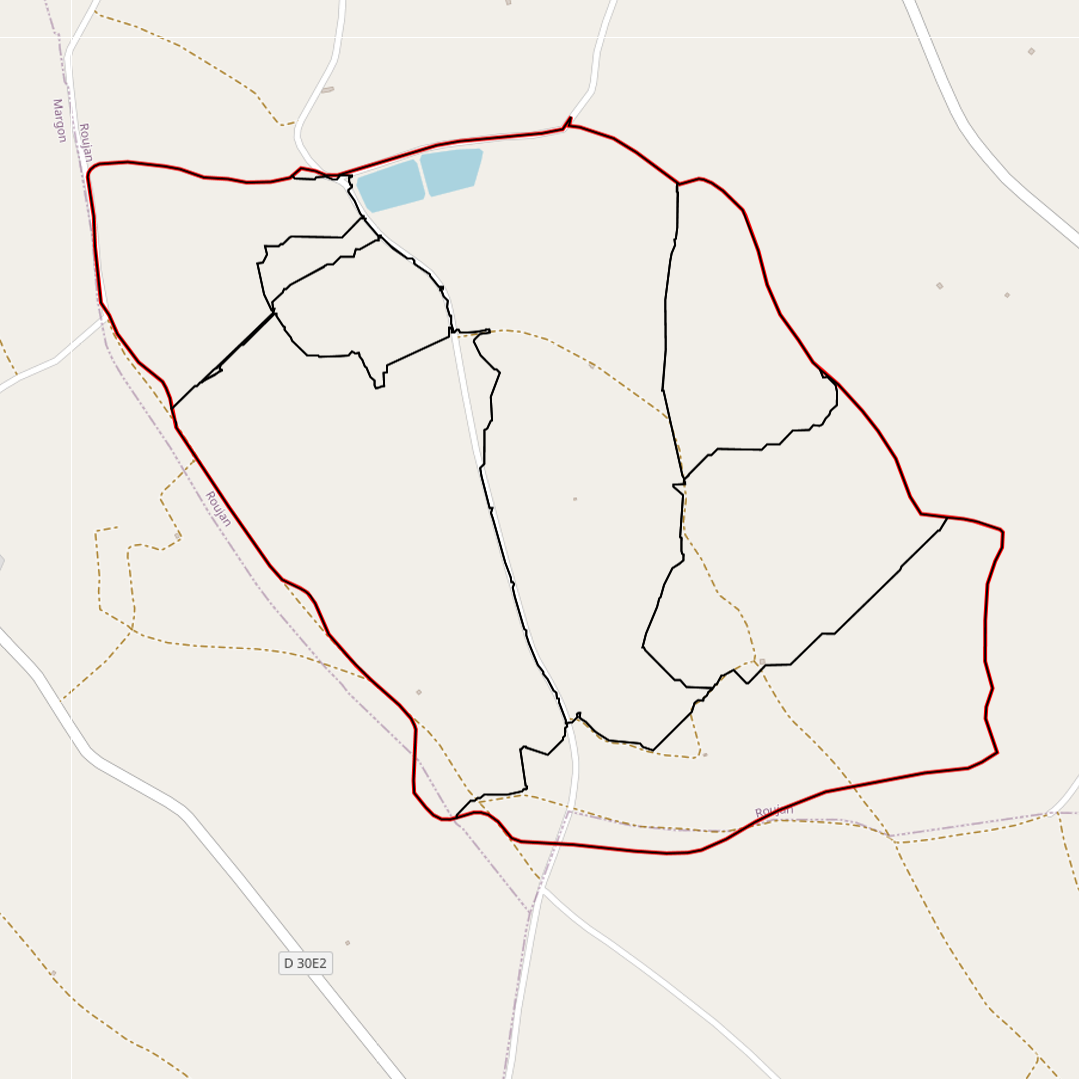
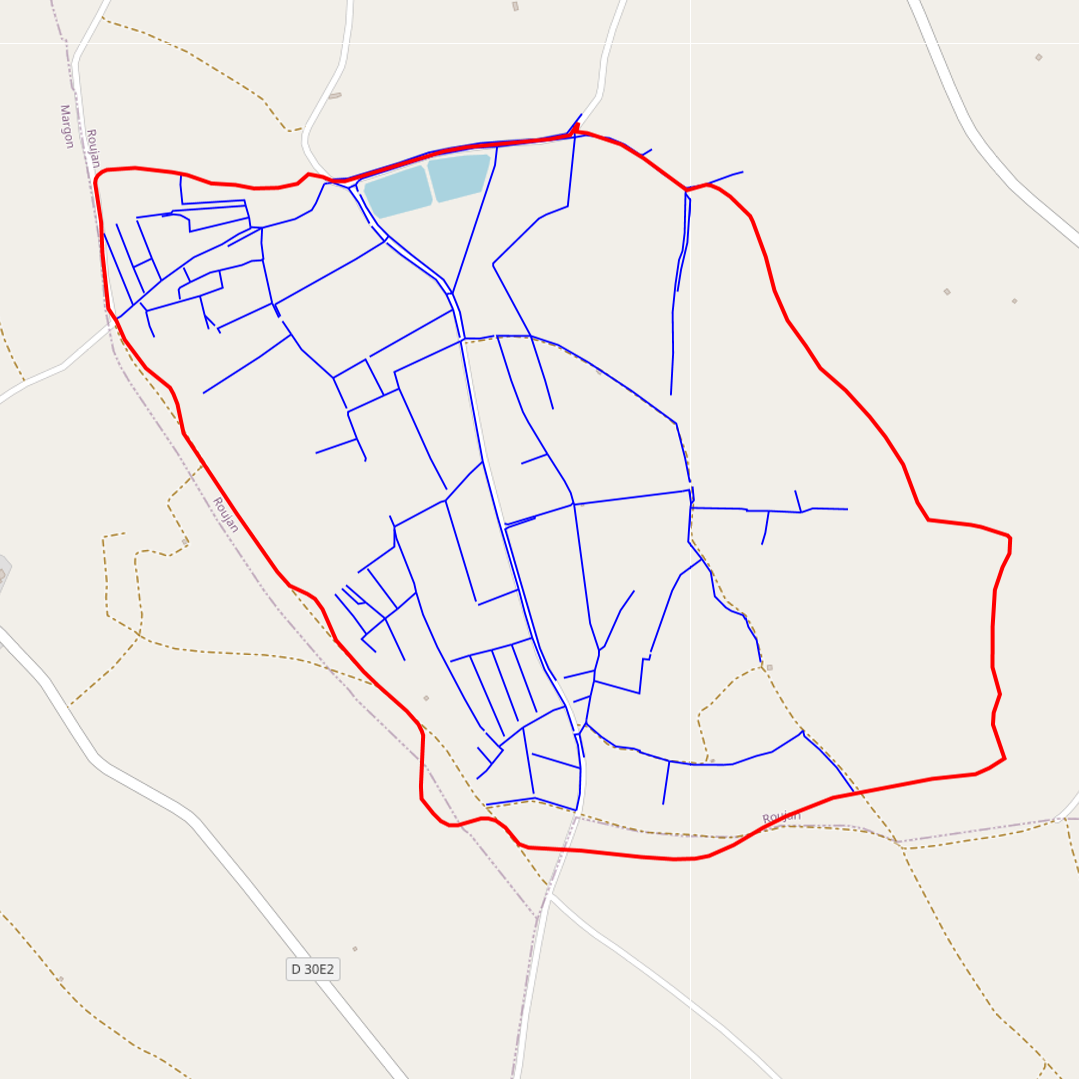
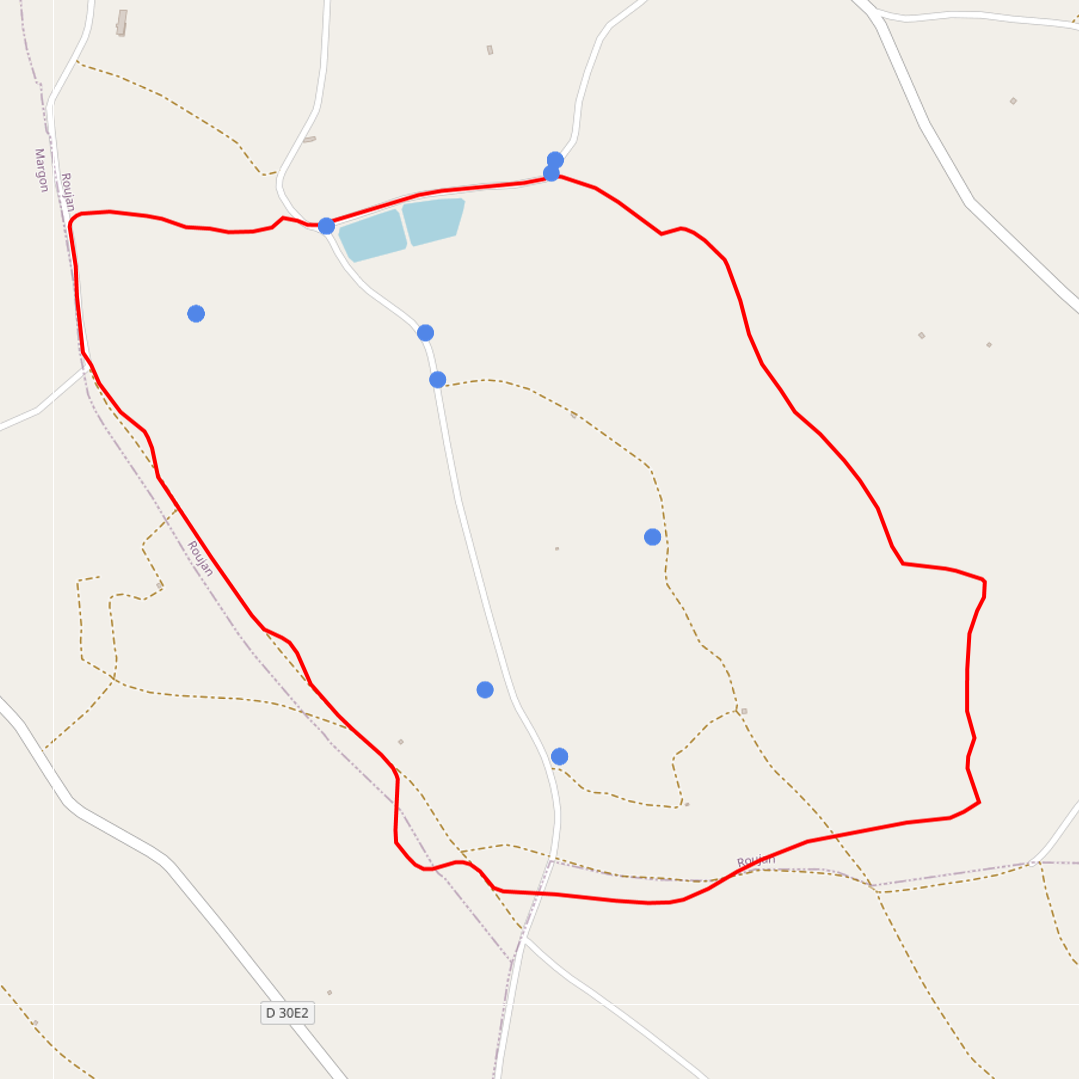
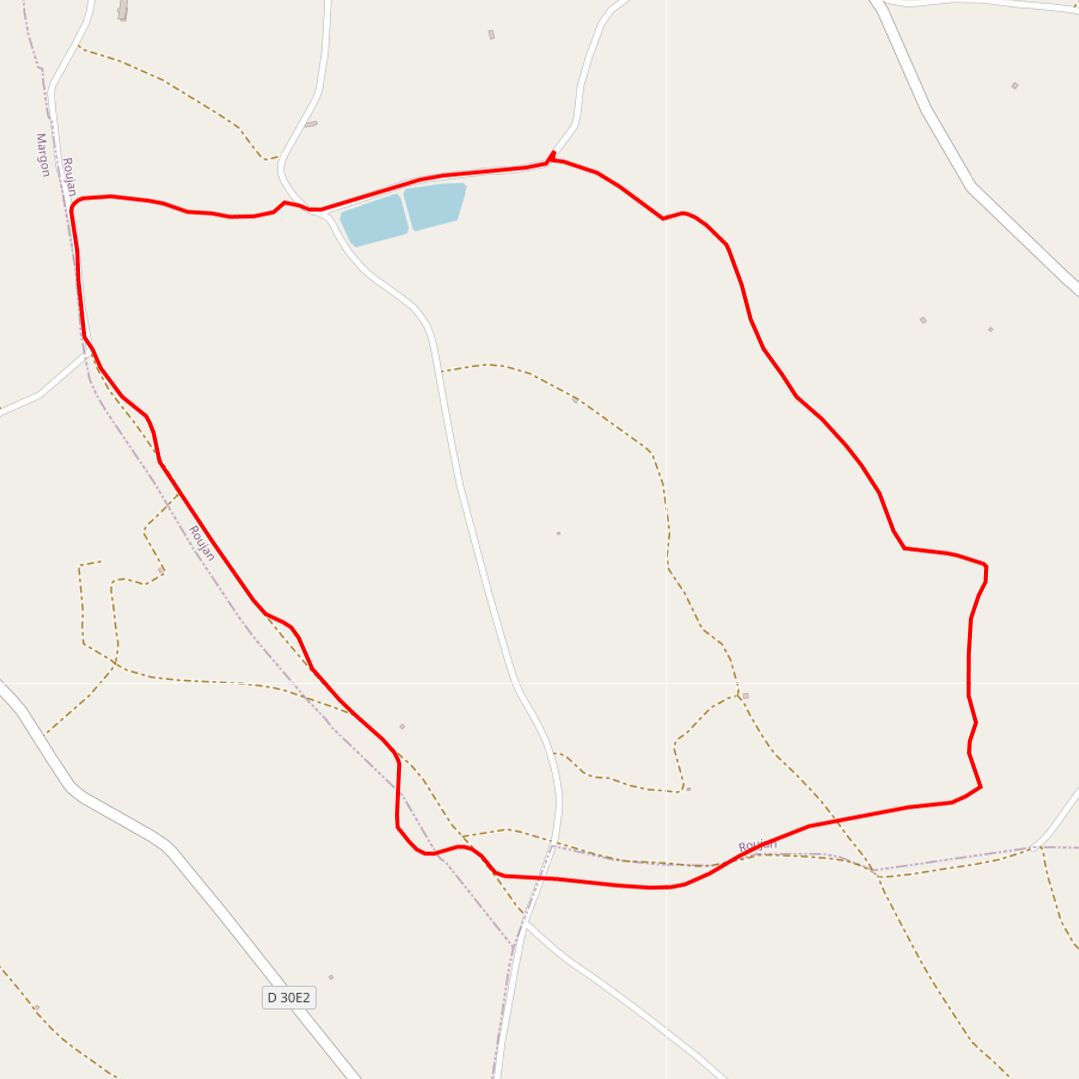
Contour map of the sub-catchment areas (Roujan)
-
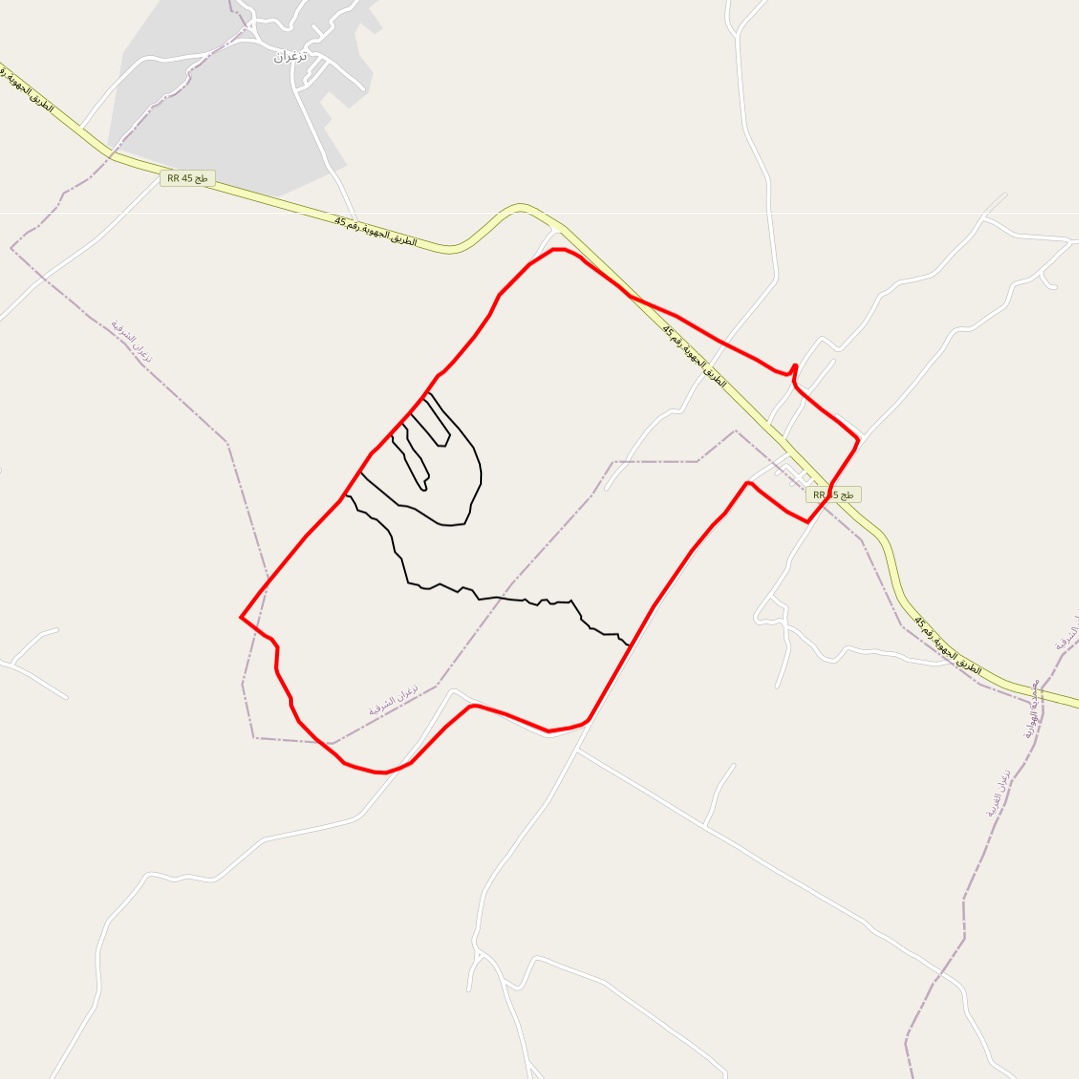
Limits of the impluviums of : - the wadi - the agronomic plot - the gully - the Kamech micro-basin
-
-
The groundwater temperature is measured at different points in the Roujan catchment. In Roujan site, the groundwater is shallow with a free surface water table rising and falling in the soil and subsoil layers. The measurements are made at different points in the catchment with piezometers. A piezometer is a perforated PVC tube at its base installed in the soil through a borehole. In every piezometer, the groundwater temperature is monitored at high frequency (~15') with autonomous and automatic temperature probe integrating acquisition units. Through the OMERE data portal accessible from this website, the data can be downloaded from an interactive map.
-
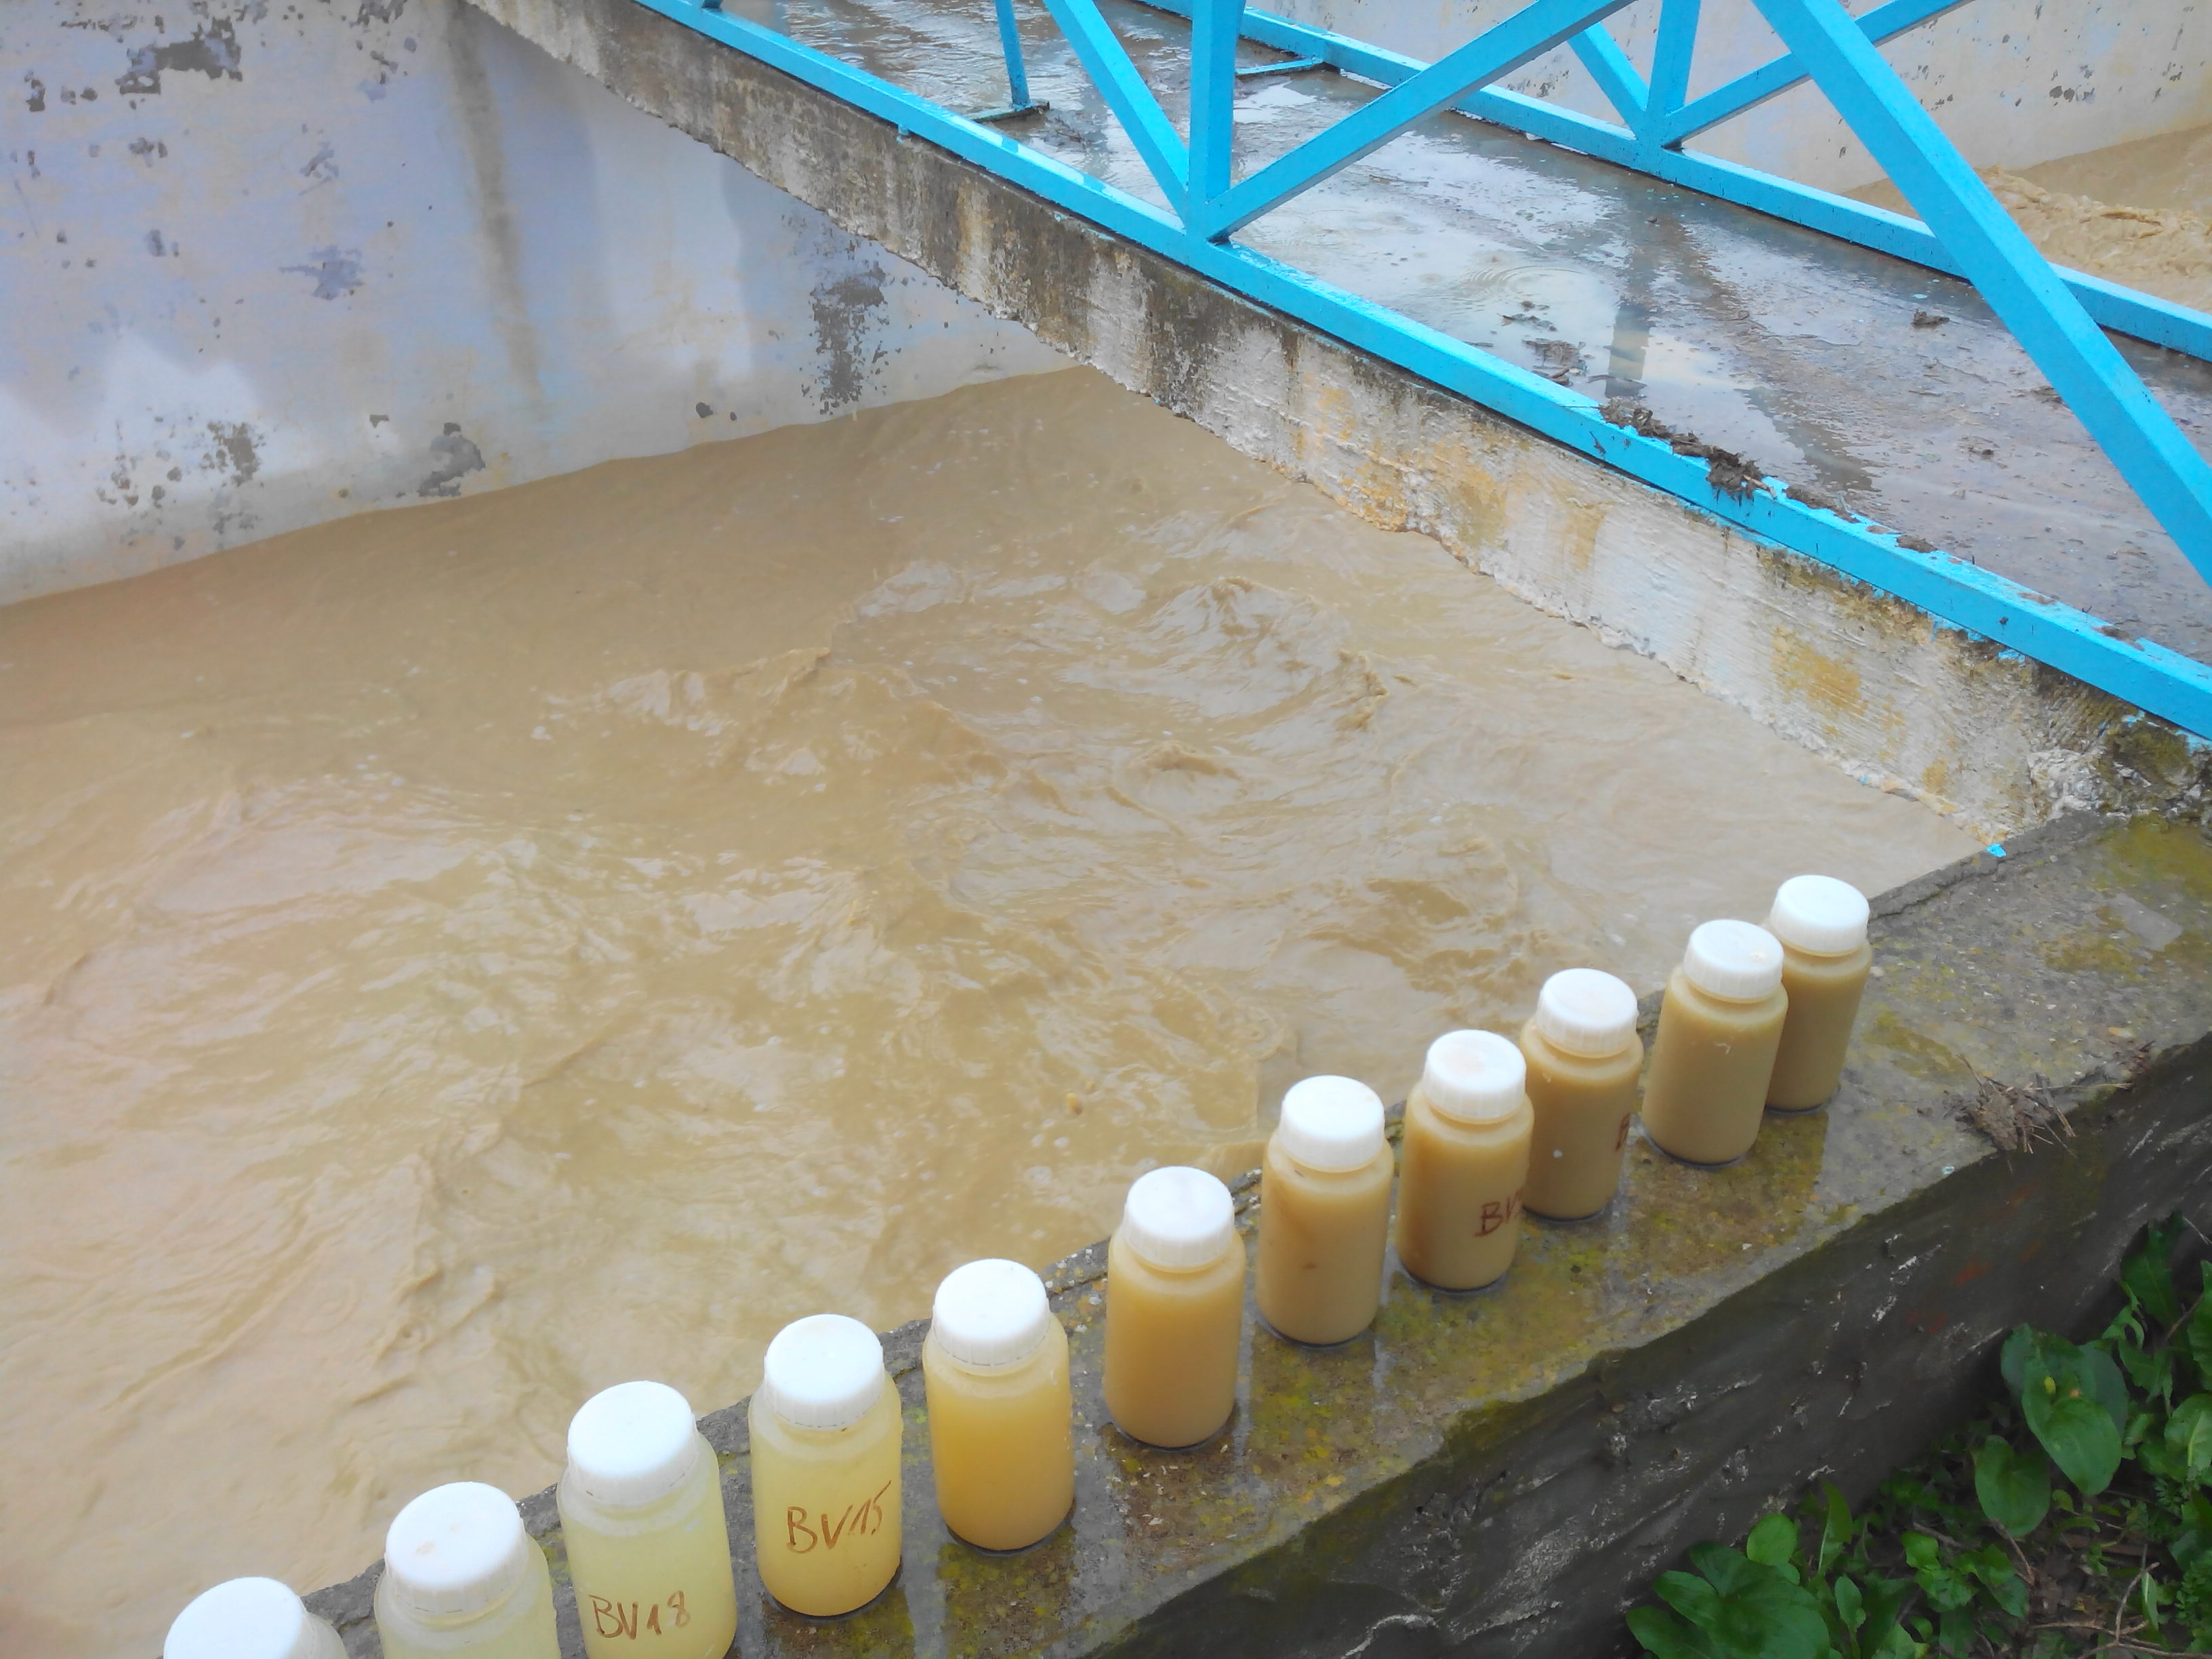
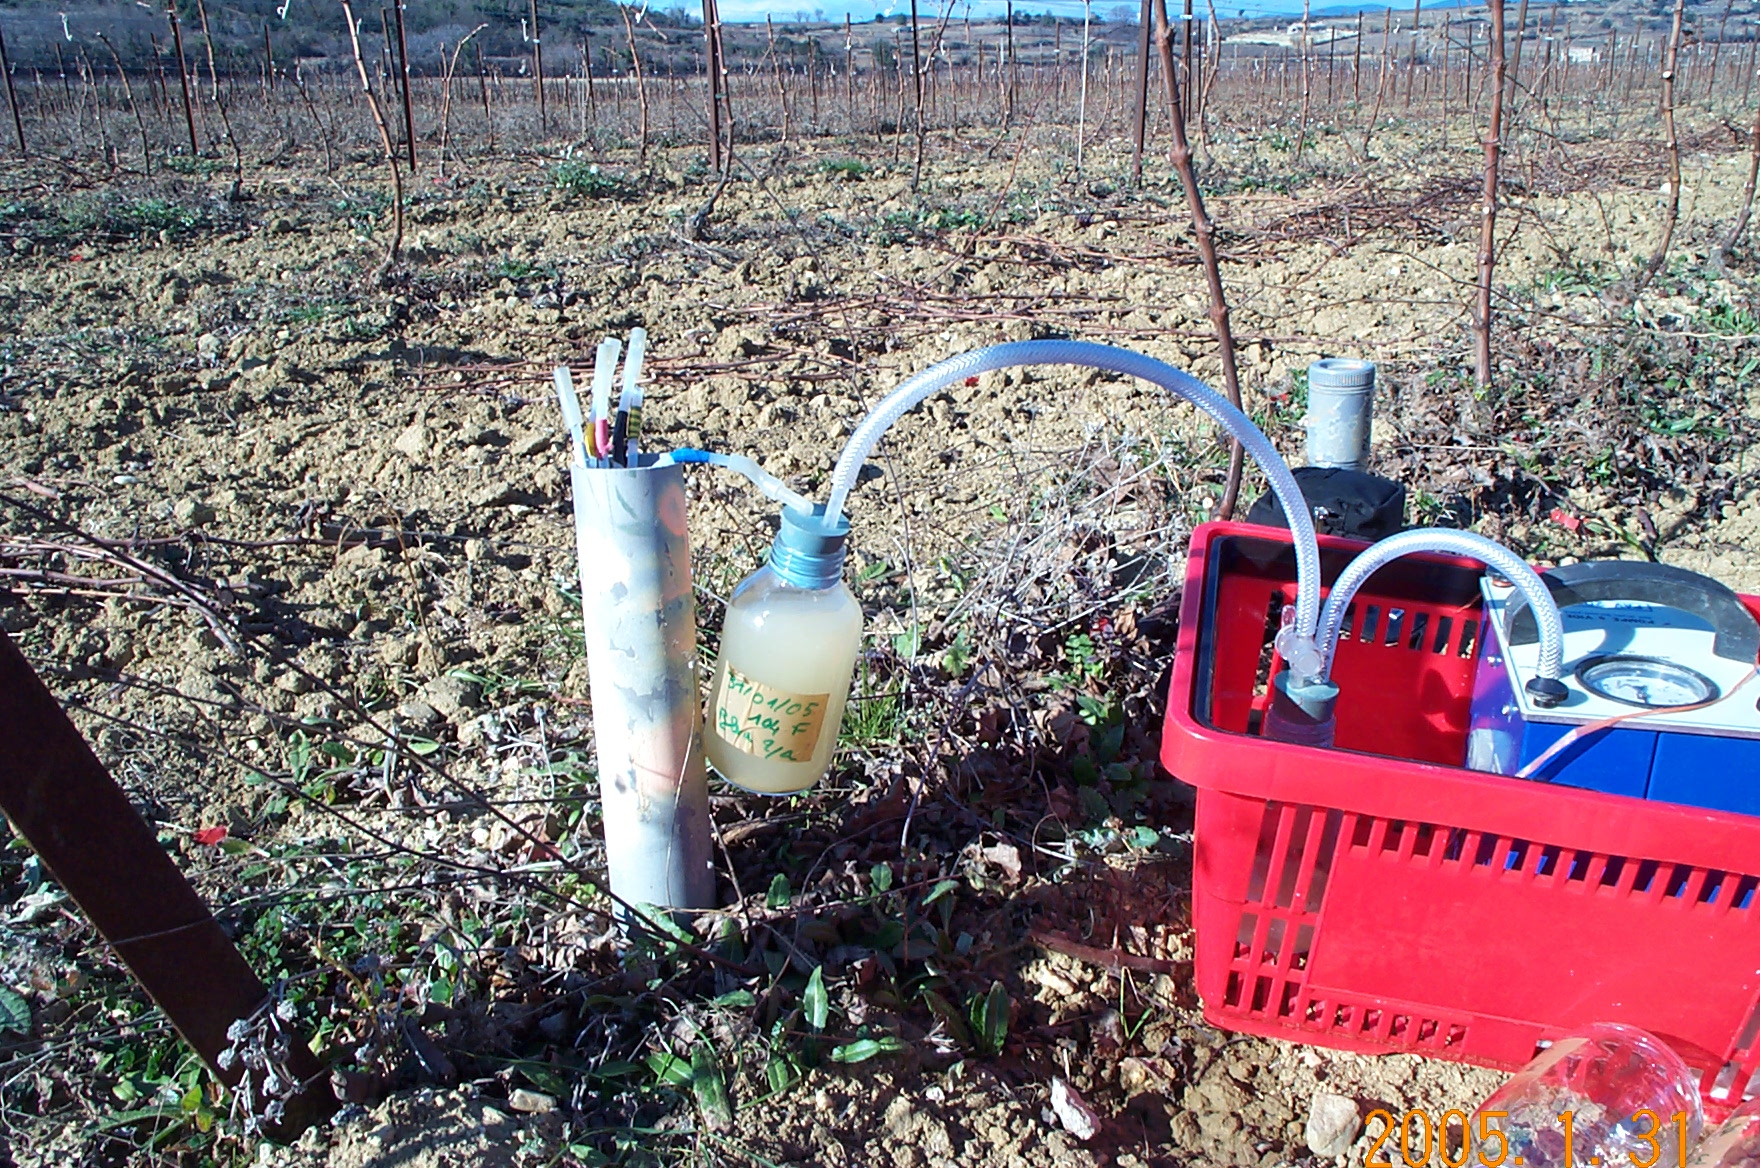
The monitoring of suspended sediment loads in runoff and stream flows aims to quantify the amount of sediments translocated during runoff events. These measurements contribute to the understanding and the quantification of the soil redistribution induced by water erosion processes. The measurements of suspended matter are made through manual and automated water sampling at the hydrological stations, which are then processed and analysed in the laboratory to derive suspended sediment concentrations. A turbidimeter has been recently installed to complete the time series of sediment discharge. Suspended sediment concentrations are integrated into the HYSAE database, they can subsequently be consulted and downloaded via the OMERE data portal.
-
These data correspond to a non-systematic monitoring of dissolved, particulate or total organic carbon contents in water (rain, surface overflow, underground water) in the Roujan catchment area.
-
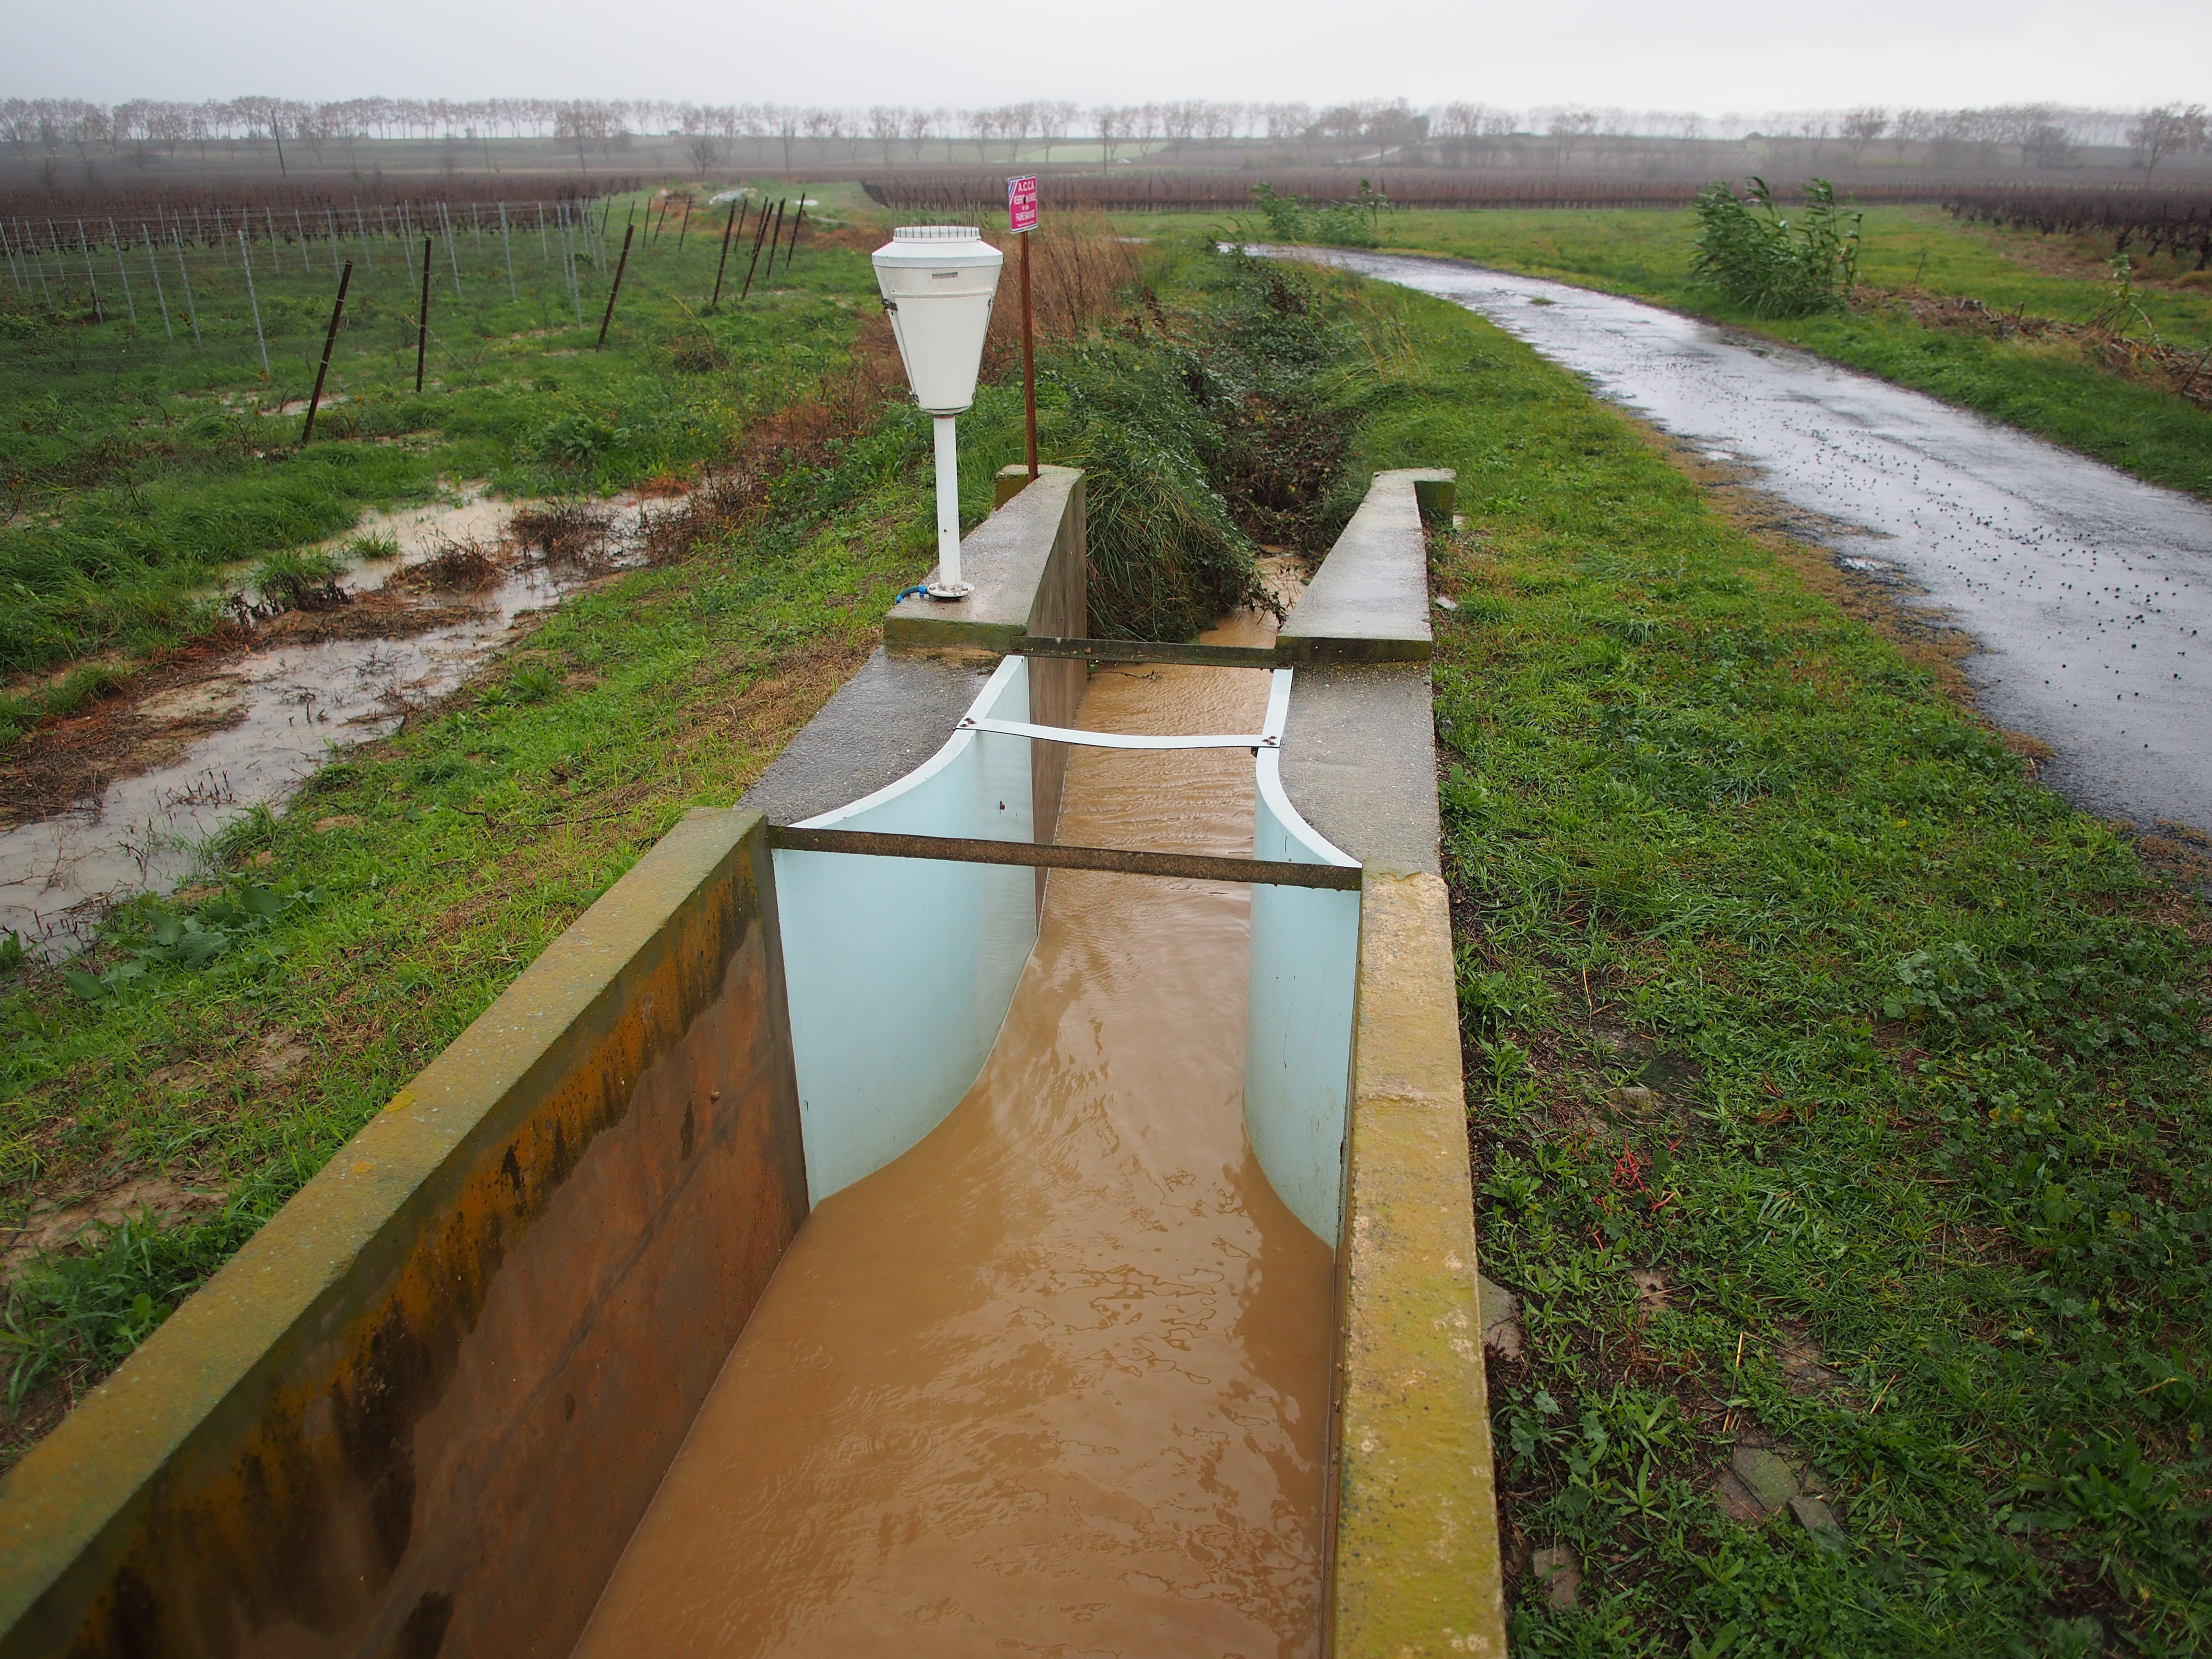
Runoff and stream flow discharge monitoring in the Roujan catchment area (Hérault) is operational since 1992 at catchment and sub-catchments hydrological stations on which automatic sensors records water level time series on a long-term and continuous basis. The data from these sensors are collected and instantaneously transmitted to servers in Montpellier. Verification and correction processes on the raw data, as well as the generation of elaborated data (e.g. calculation of flows from water heights or modification of time steps) are applied before integration of the data sets into the HYSAE database. The water level and discharge time series can be downloaded from an interactive map through the OMERE data portal accessible from this page.
-
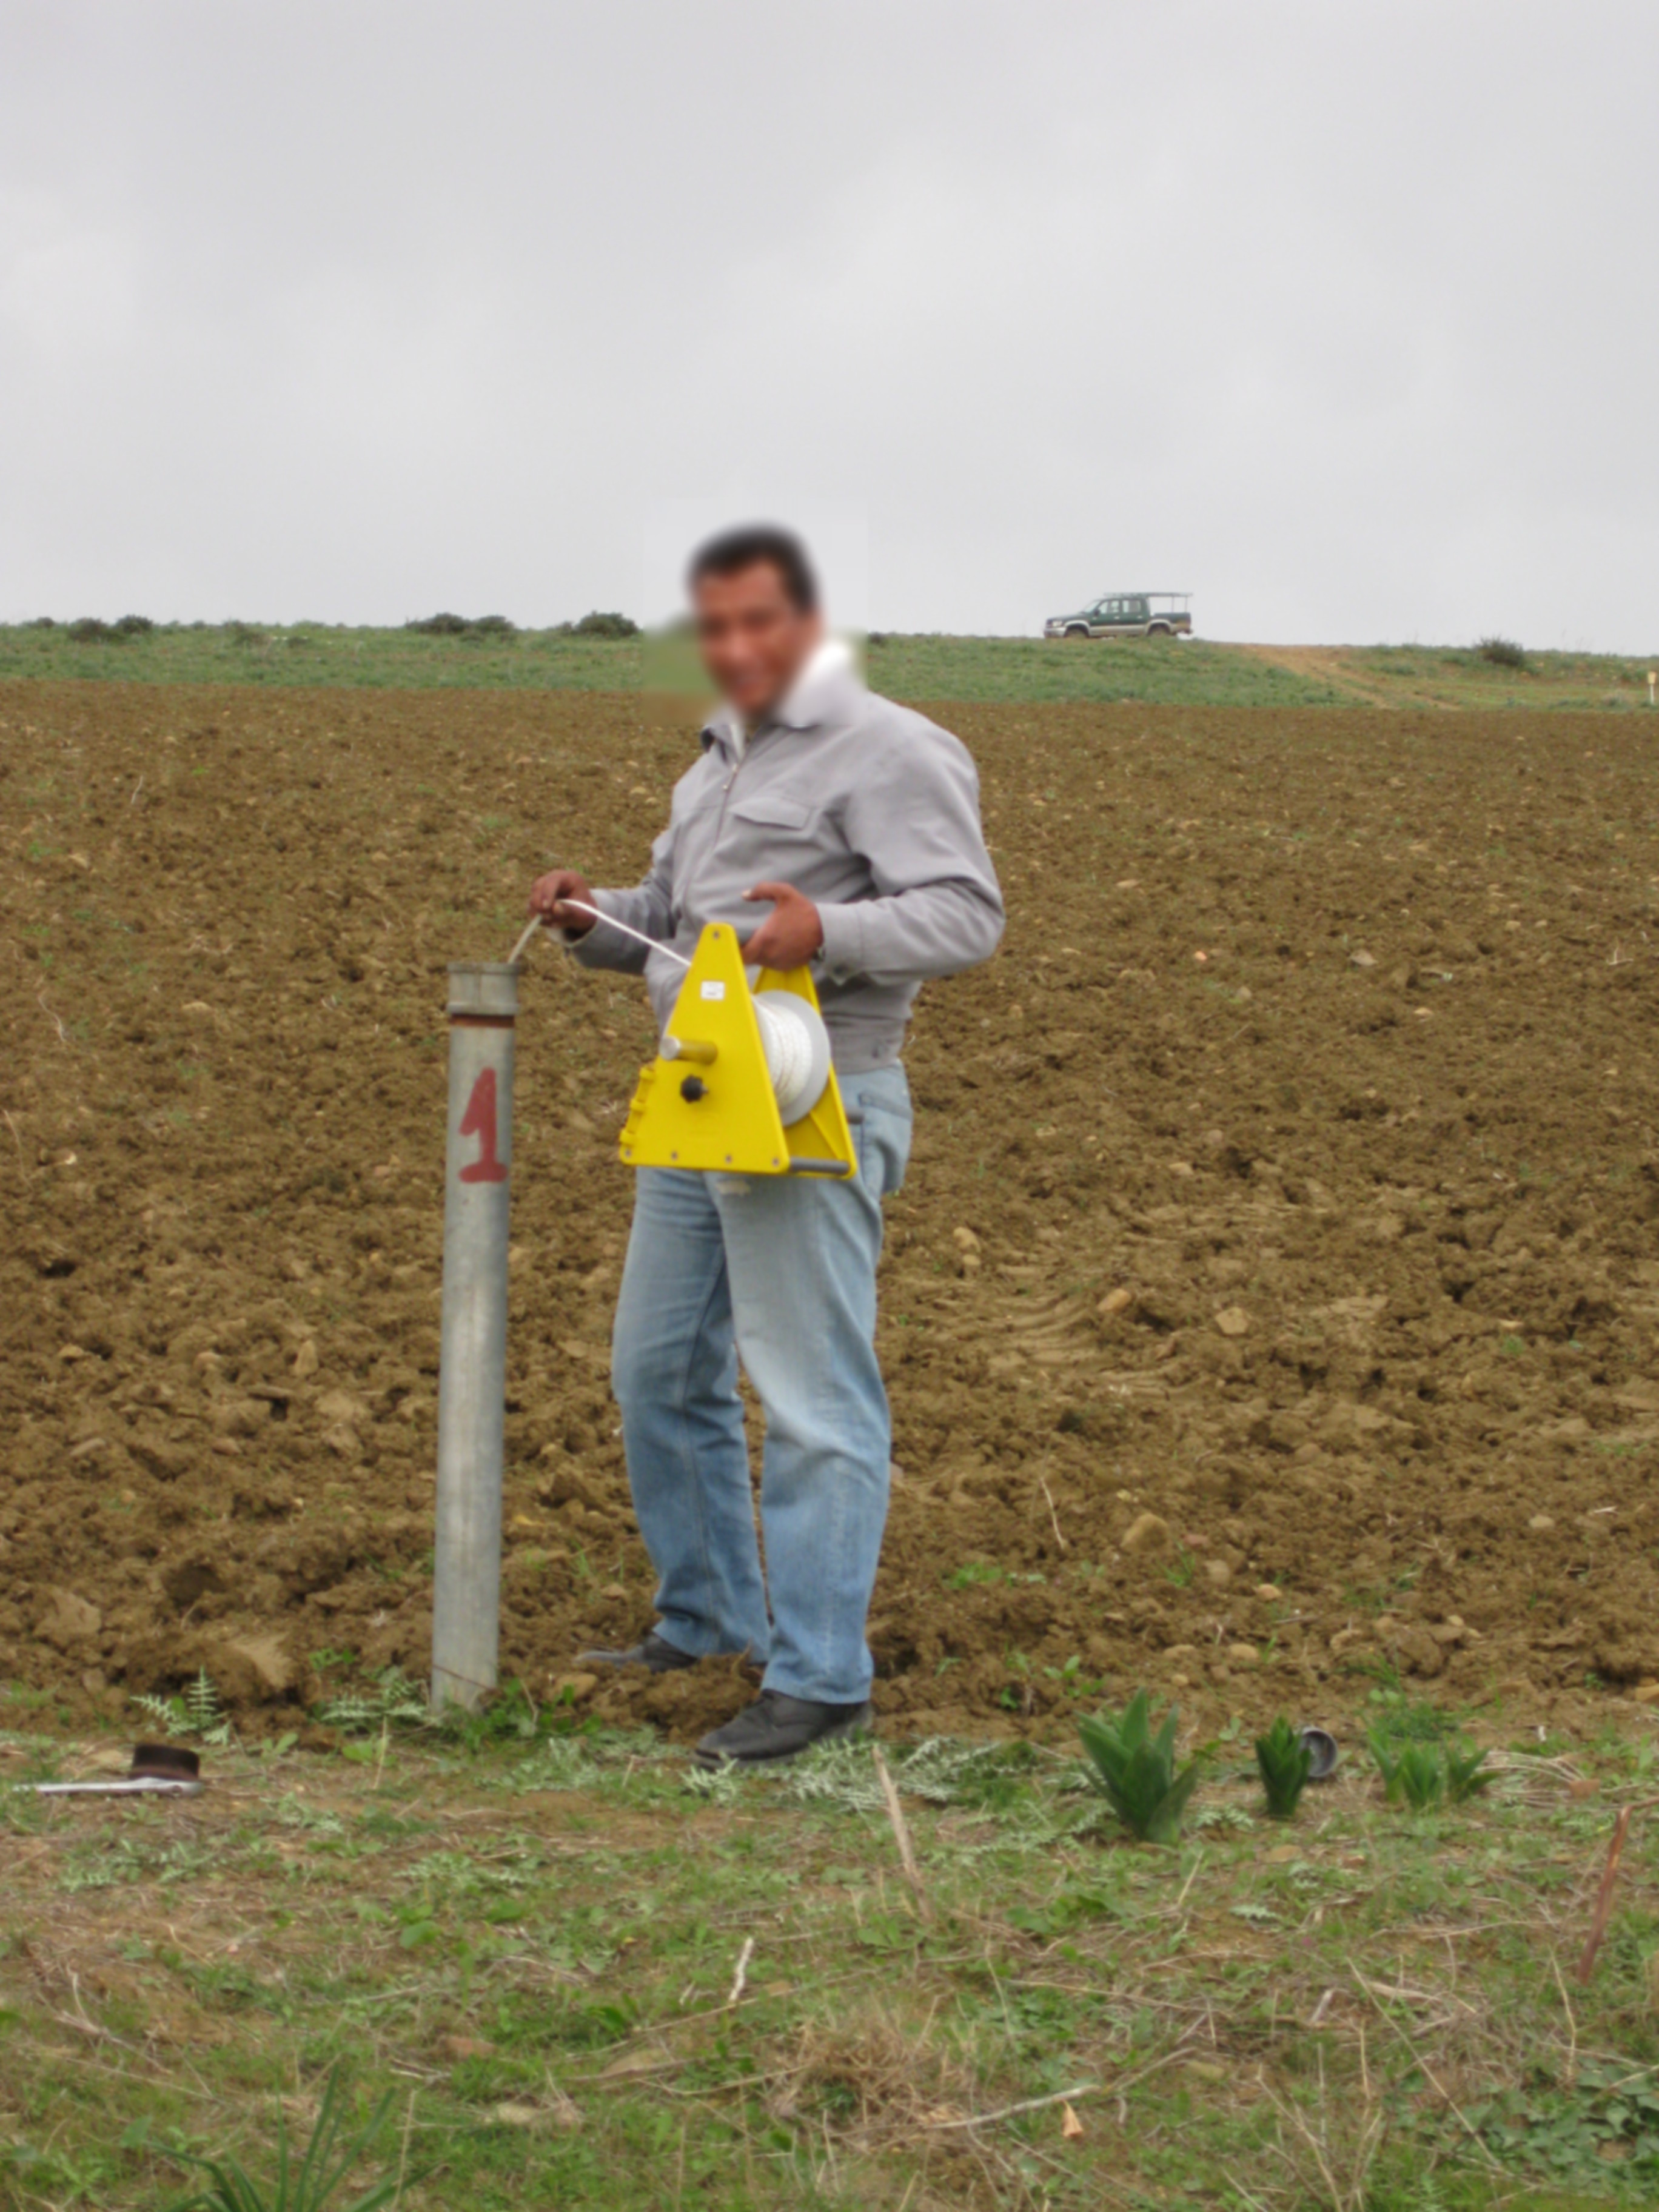
The water table depth from the soil surface is measured at different points in the Kamech catchment. In Kamech site, the groundwater is shallow with a free surface water table rising and falling in the soil and subsoil layers. The measurements are made at different points in the catchment with piezometers. A piezometer is a perforated PVC tube at its base installed in the soil through a borehole. In every piezometer, the water table depth is measured by manual piezometric probe or monitored at high frequency (~15') with autonomous and automatic probe integrating acquisition units. Through the OMERE data portal accessible from this website, the data can be downloaded from an interactive map.
-
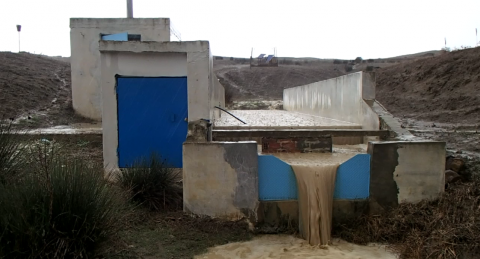
Runoff and stream flow discharge have been monitored since 1994 at the outlet of the Kamech catchment, and since 2005 at four sub-catchment hydrological stations. Automatic sensors continuously collected and transmitted water level time series to servers in Montpellier (France). Verification and correction processes on the raw data, as well as the generation of elaborated data (e.g. calculation of runoff, discharge from water levels, modification of time steps, etc) are applied before integration of the data sets into the HYSAE database. The time series can be downloaded from an interactive map through the OMERE data portal accessible from this page.